
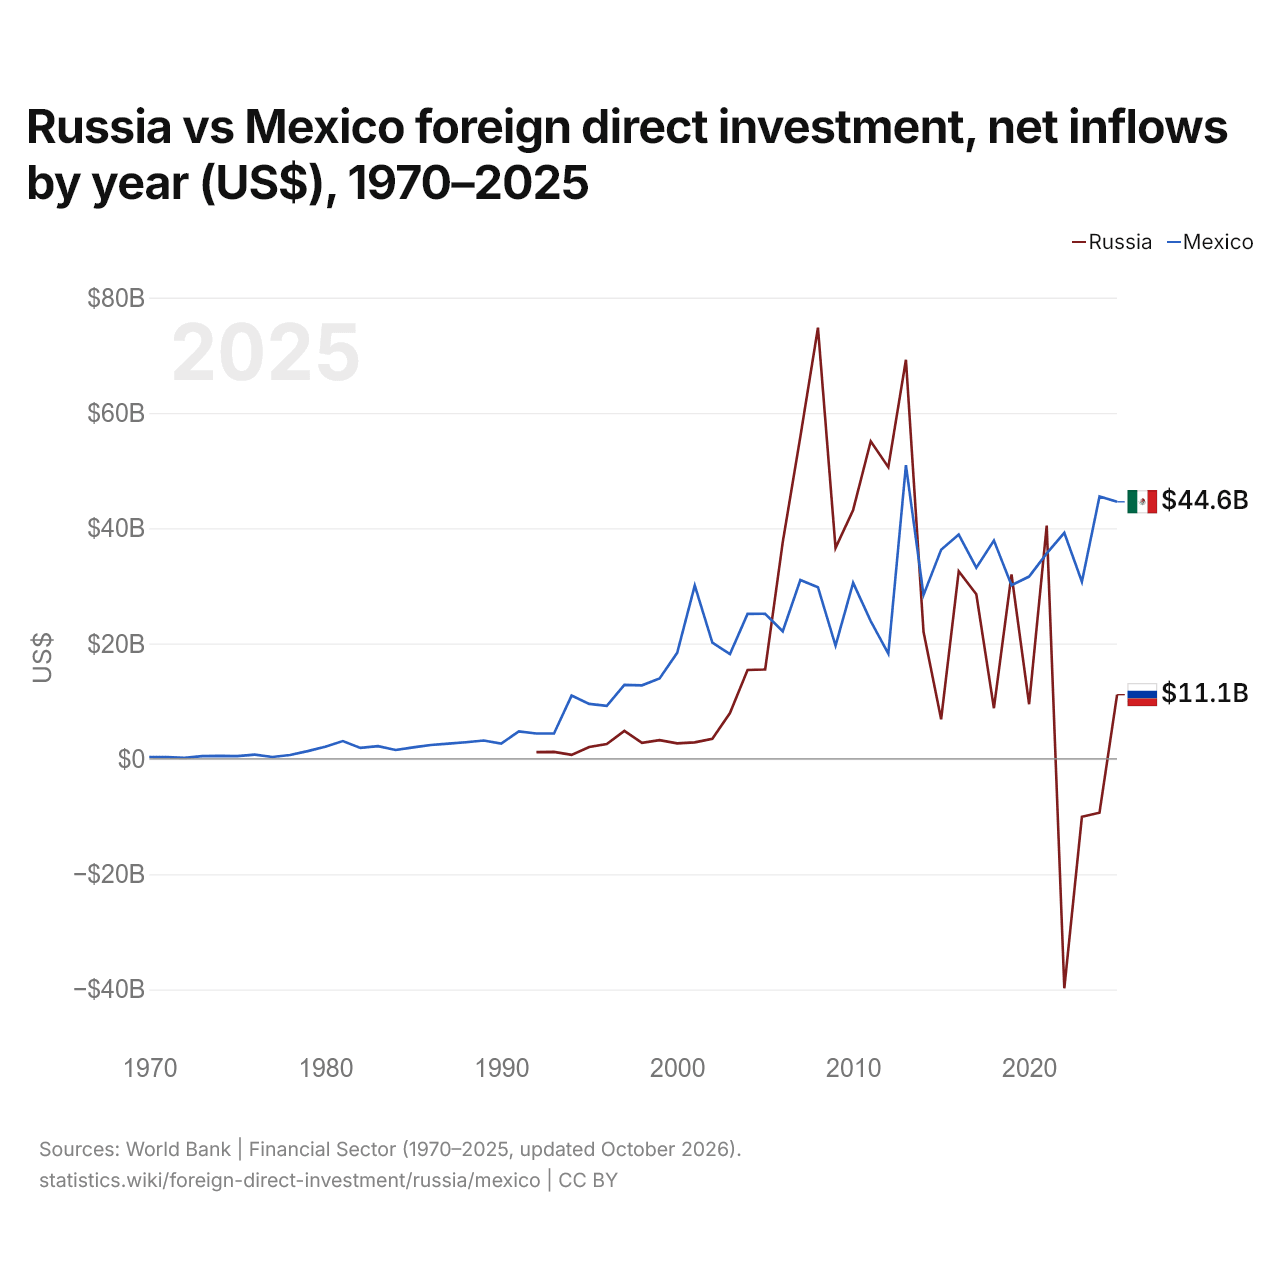
Rússia vs México: investimento estrangeiro direto, entradas líquidas por ano (US$), 1970–2025
1x
| Ano | US$ | |
|---|---|---|
 Rússia |
 México |
|
| 2025 | US$ 11.136.480.000 | US$ 44.581.815.369 |
| 2024 | US$ −9.350.260.000 | US$ 45.509.203.172 |
| 2023 | US$ −10.045.120.000 | US$ 30.716.199.798 |
| 2022 | US$ −39.800.944.227 | US$ 39.210.639.718 |
| 2021 | US$ 40.450.000.000 | US$ 35.625.227.011 |
| 2020 | US$ 9.478.810.000 | US$ 31.615.820.278 |
| 2019 | US$ 31.974.770.000 | US$ 30.127.764.689 |
| 2018 | US$ 8.784.850.000 | US$ 37.870.342.199 |
| 2017 | US$ 28.557.440.000 | US$ 33.161.415.255 |
| 2016 | US$ 32.538.900.000 | US$ 38.902.421.828 |
| 2015 | US$ 6.852.970.000 | US$ 36.251.706.559 |
| 2014 | US$ 22.031.340.000 | US$ 28.439.401.613 |
| 2013 | US$ 69.218.890.000 | US$ 50.930.132.122 |
| 2012 | US$ 50.587.560.000 | US$ 18.232.395.429 |
| 2011 | US$ 55.083.630.000 | US$ 23.894.819.691 |
| 2010 | US$ 43.167.780.000 | US$ 30.534.440.371 |
| 2009 | US$ 36.583.100.000 | US$ 19.652.900.654 |
| 2008 | US$ 74.782.910.000 | US$ 29.772.354.828 |
| 2007 | US$ 55.873.680.000 | US$ 31.020.146.278 |
| 2006 | US$ 37.594.770.000 | US$ 22.128.843.203 |
| 2005 | US$ 15.508.050.000 | US$ 25.161.667.683 |
| 2004 | US$ 15.402.990.000 | US$ 25.142.732.841 |
| 2003 | US$ 7.928.630.000 | US$ 18.157.929.031 |
| 2002 | US$ 3.473.830.000 | US$ 20.160.111.120 |
| 2001 | US$ 2.847.300.000 | US$ 30.060.020.323 |
| 2000 | US$ 2.678.030.000 | US$ 18.382.284.821 |
| 1999 | US$ 3.256.530.000 | US$ 13.941.043.232 |
| 1998 | US$ 2.761.360.000 | US$ 12.756.764.558 |
| 1997 | US$ 4.864.650.000 | US$ 12.829.800.000 |
| 1996 | US$ 2.579.330.000 | US$ 9.185.600.000 |
| 1995 | US$ 2.065.720.000 | US$ 9.526.290.000 |
| 1994 | US$ 689.570.000 | US$ 10.972.500.000 |
| 1993 | US$ 1.210.782.000 | US$ 4.389.000.000 |
| 1992 | US$ 1.161.000.000 | US$ 4.393.000.000 |
| 1991 | - | US$ 4.762.000.000 |
| 1990 | - | US$ 2.634.000.000 |
| 1989 | - | US$ 3.174.000.000 |
| 1988 | - | US$ 2.879.000.000 |
| 1987 | - | US$ 2.634.000.000 |
| 1986 | - | US$ 2.400.000.000 |
| 1985 | - | US$ 1.984.000.000 |
| 1984 | - | US$ 1.542.000.000 |
| 1983 | - | US$ 2.192.000.000 |
| 1982 | - | US$ 1.901.000.000 |
| 1981 | - | US$ 3.078.000.000 |
| 1980 | - | US$ 2.090.000.000 |
| 1979 | - | US$ 1.332.000.000 |
| 1978 | - | US$ 658.163.000 |
| 1977 | - | US$ 327.102.000 |
| 1976 | - | US$ 731.451.000 |
| 1975 | - | US$ 458.411.000 |
| 1974 | - | US$ 508.756.000 |
| 1973 | - | US$ 457.000.000 |
| 1972 | - | US$ 178.385.000 |
| 1971 | - | US$ 307.000.000 |
| 1970 | - | US$ 312.107.000 |
Em 2025, as entradas líquidas de investimento estrangeiro direto foram de US$ 11,1 bilhões na Rússia e de US$ 44,6 bilhões no México: 4,0 vezes mais no México. Em 1992, foram de US$ 1,16 bilhão na Rússia e de US$ 4,39 bilhões no México.
As entradas líquidas de investimento estrangeiro direto na Rússia foram maiores que no México em 10 dos 34 anos de 1992 a 2025, e menores em 24.
Rússia vs México: entradas e saídas mais recentes de investimento estrangeiro
|
Rússia
|
México
|
|
|---|---|---|
| Entradas líquidas | +US$ 11,1 bi | +US$ 44,6 bi |
| Entradas líquidas, % do PIB | +0,4% | +2,4% |
| Saídas líquidas | -US$ 5,46 bi | +US$ 13,0 bi |
| Entradas líquidas, total 2016–2025 | +US$ 104 bi | +US$ 367 bi |
| Posição mundial | 35/192 | 11/192 |
Comparar o investimento estrangeiro direto de 2 países quaisquer
Fontes:
- Banco Mundial | Financial Sector (1970–2025, atualizado em outubro de 2026)
Creative Commons Atribuição (CC BY): você pode copiar, compartilhar, adaptar e reutilizar este conteúdo, inclusive para fins comerciais, desde que cite o statistics.wiki e indique as alterações que fizer. As fontes listadas acima podem ter suas próprias condições de licença.