
Portugal vs Iraque: investimento estrangeiro direto, entradas líquidas por ano (US$), 1970–2025
1x
| Ano | US$ | |
|---|---|---|
 Portugal |
 Iraque |
|
| 2025 | US$ 11.968.828.949 | US$ −7.618.200.000 |
| 2024 | US$ 12.908.896.806 | US$ −7.648.900.000 |
| 2023 | US$ 11.565.129.636 | US$ −5.363.500.000 |
| 2022 | US$ 13.059.930.356 | US$ −2.088.200.000 |
| 2021 | US$ 9.239.418.034 | US$ −2.637.300.000 |
| 2020 | US$ 4.165.618.741 | US$ −2.859.100.000 |
| 2019 | US$ 10.814.567.641 | US$ −3.075.600.000 |
| 2018 | US$ 8.390.559.335 | US$ −4.885.100.000 |
| 2017 | US$ 11.088.239.862 | US$ −5.032.400.000 |
| 2016 | US$ 7.350.311.647 | US$ −6.255.900.000 |
| 2015 | US$ 1.264.336.593 | US$ −7.574.200.000 |
| 2014 | US$ 12.512.849.287 | US$ −10.176.400.000 |
| 2013 | US$ 14.590.189.382 | US$ −2.335.300.000 |
| 2012 | US$ 15.623.883.335 | US$ 3.400.000.000 |
| 2011 | US$ 10.397.474.492 | US$ 2.082.000.000 |
| 2010 | US$ 8.998.318.742 | US$ 1.396.200.000 |
| 2009 | US$ 5.752.968.835 | US$ 1.598.300.000 |
| 2008 | US$ 7.820.637.676 | US$ 1.855.700.000 |
| 2007 | US$ 6.014.642.427 | US$ 971.800.000 |
| 2006 | US$ 13.394.502.768 | US$ 383.000.000 |
| 2005 | US$ 3.367.937.007 | US$ 515.300.000 |
| 2004 | US$ 2.485.161.769 | US$ 300.000.000 |
| 2003 | US$ 10.354.679.114 | US$ 1.000.000.000 |
| 2002 | US$ 587.893.730 | US$ −326.000 |
| 2001 | US$ 6.113.785.654 | US$ −6.656.000 |
| 2000 | US$ 7.292.581.671 | US$ −32.000 |
| 1999 | US$ 740.701.804 | - |
| 1998 | US$ 6.071.328.303 | US$ 7.388.000 |
| 1997 | US$ 2.710.655.380 | US$ 1.153.000 |
| 1996 | US$ 1.571.447.865 | US$ −1.994.000 |
| 1995 | US$ 684.572.214 | - |
| 1994 | US$ 1.269.714.976 | US$ −30.000 |
| 1993 | US$ 1.533.880.551 | US$ 803.000 |
| 1992 | US$ 1.873.428.553 | US$ 93.000 |
| 1991 | US$ 2.448.454.131 | US$ 7.686.000 |
| 1990 | US$ 2.609.986.421 | US$ −6.810.000 |
| 1989 | US$ 1.736.891.397 | US$ 390.000 |
| 1988 | US$ 921.583.433 | US$ −3.383.000 |
| 1987 | US$ 465.868.833 | US$ −4.291.000 |
| 1986 | US$ 238.151.216 | US$ 918.000 |
| 1985 | US$ 274.036.105 | US$ −1.160.000 |
| 1984 | US$ 198.221.489 | US$ −2.749.000 |
| 1983 | US$ 146.837.897 | US$ −234.000 |
| 1982 | US$ 144.033.052 | US$ 2.420.000 |
| 1981 | US$ 174.486.586 | US$ 4.120.000 |
| 1980 | US$ 156.950.738 | US$ 1.530.000 |
| 1979 | US$ 78.304.051 | US$ 1.610.000 |
| 1978 | US$ 65.993.577 | US$ 300.000 |
| 1977 | US$ 57.914.758 | US$ 4.390.000 |
| 1976 | US$ 62.999.101 | US$ 1.350.000 |
| 1975 | US$ 115.351.291 | US$ −44.920.000 |
| 1974 | US$ 106.000.000 | US$ −8.830.000 |
| 1973 | US$ 95.000.000 | US$ −6.550.000 |
| 1972 | US$ 73.000.000 | US$ −90.000 |
| 1971 | US$ 56.000.000 | US$ −180.000 |
| 1970 | US$ 28.900.000 | US$ −910.000 |
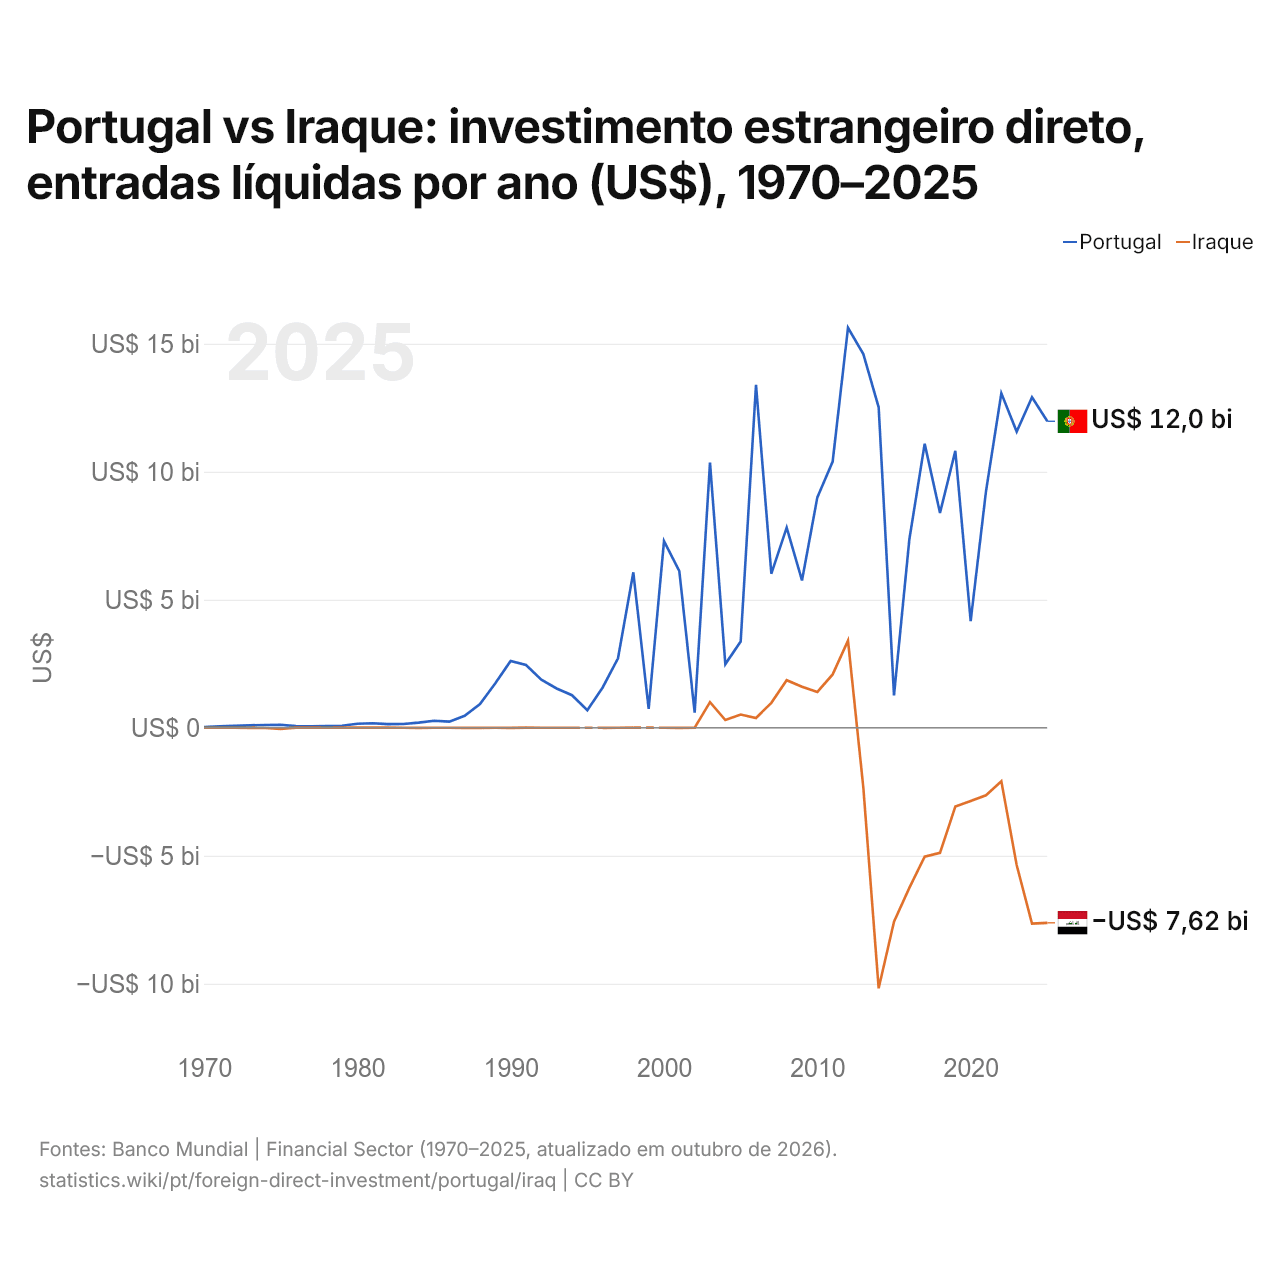
Em 2025, as entradas líquidas de investimento estrangeiro direto foram de US$ 12 bilhões em Portugal e negativas no Iraque, de US$ 7,62 bilhões. Em 1970, foram de US$ 28,9 milhões em Portugal e negativas no Iraque, de US$ 910.000.
As entradas líquidas de investimento estrangeiro direto em Portugal foram maiores que no Iraque em cada um dos 54 anos de 1970 a 2025 que os dois países informaram.
Portugal vs Iraque: entradas e saídas mais recentes de investimento estrangeiro
|
Portugal
|
Iraque
|
|
|---|---|---|
| Entradas líquidas | +US$ 12,0 bi | -US$ 7,62 bi |
| Entradas líquidas, % do PIB | +3,5% | −3,0% |
| Saídas líquidas | +US$ 8,91 bi | +US$ 422 mi |
| Entradas líquidas, total 2016–2025 | +US$ 101 bi | -US$ 47,5 bi |
| Posição mundial | 32/192 | 188/192 |
Comparar o investimento estrangeiro direto de 2 países quaisquer
Fontes:
- Banco Mundial | Financial Sector (1970–2025, atualizado em outubro de 2026)
Creative Commons Atribuição (CC BY): você pode copiar, compartilhar, adaptar e reutilizar este conteúdo, inclusive para fins comerciais, desde que cite o statistics.wiki e indique as alterações que fizer. As fontes listadas acima podem ter suas próprias condições de licença.