
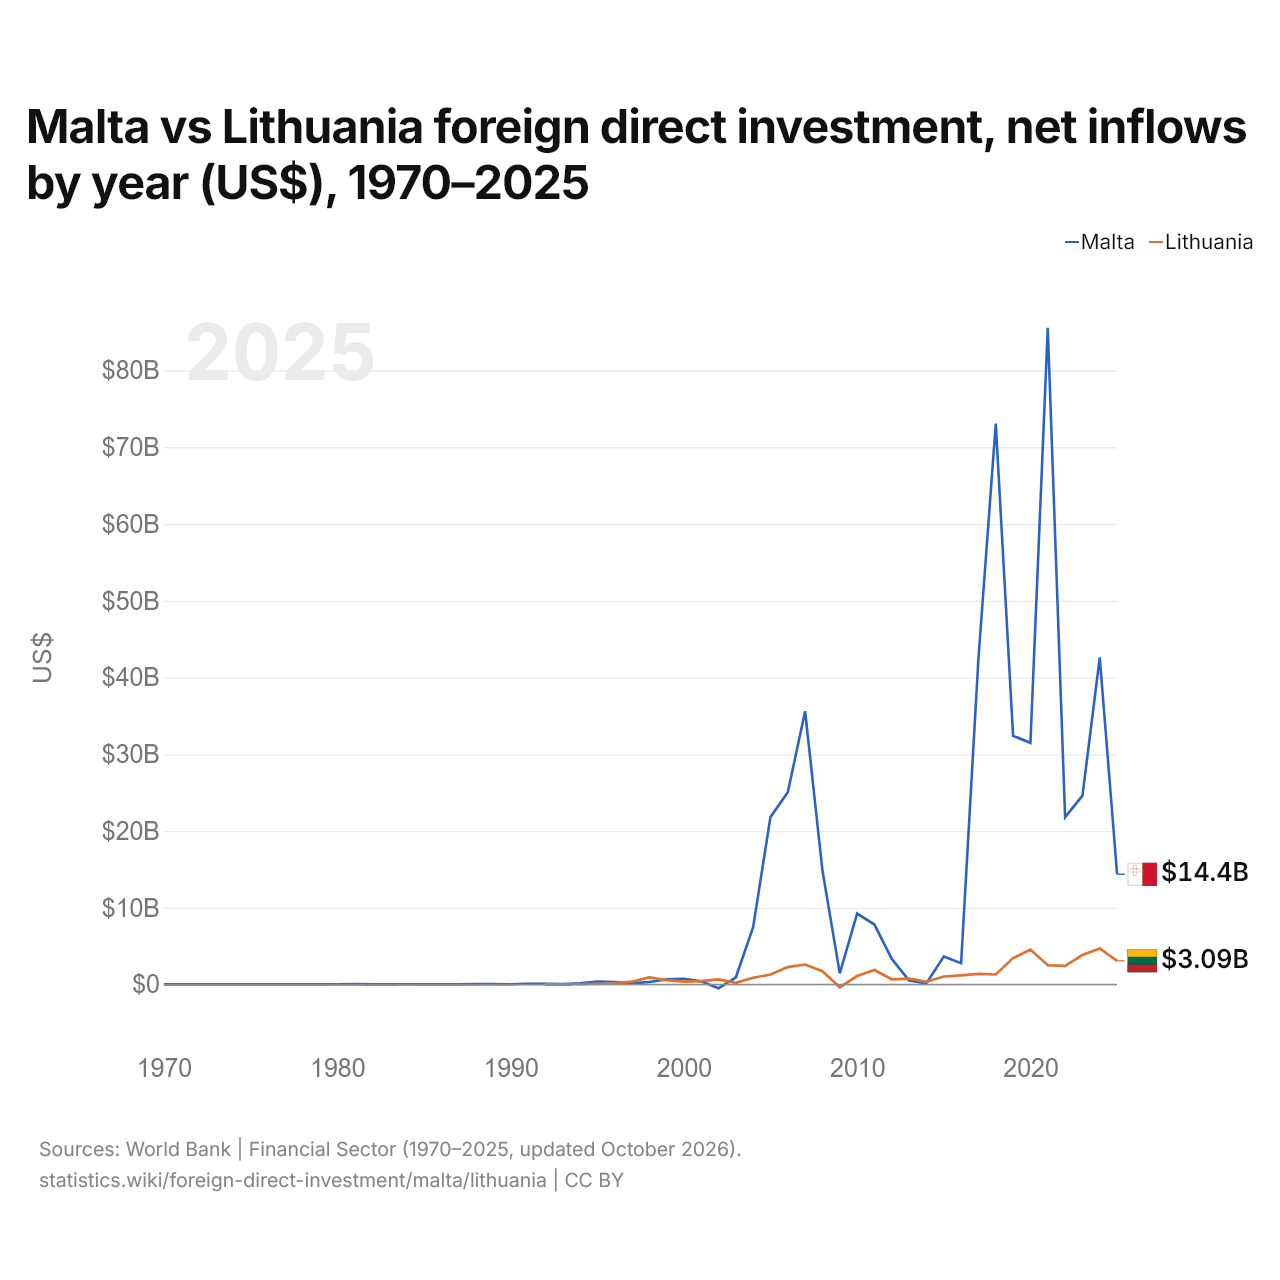
Malta vs Lituânia: investimento estrangeiro direto, entradas líquidas por ano (US$), 1970–2025
1x
| Ano | US$ | |
|---|---|---|
 Malta |
 Lituânia |
|
| 2025 | US$ 14.360.354.761 | US$ 3.087.317.447 |
| 2024 | US$ 42.586.013.467 | US$ 4.700.199.443 |
| 2023 | US$ 24.601.713.594 | US$ 3.831.114.464 |
| 2022 | US$ 21.777.714.703 | US$ 2.419.329.634 |
| 2021 | US$ 85.551.145.633 | US$ 2.507.626.416 |
| 2020 | US$ 31.484.121.889 | US$ 4.560.496.003 |
| 2019 | US$ 32.381.439.863 | US$ 3.434.299.310 |
| 2018 | US$ 73.050.789.630 | US$ 1.299.841.764 |
| 2017 | US$ 42.459.309.426 | US$ 1.383.731.106 |
| 2016 | US$ 2.776.034.108 | US$ 1.177.533.776 |
| 2015 | US$ 3.640.705.147 | US$ 1.036.954.106 |
| 2014 | US$ 155.878.728 | US$ 357.323.216 |
| 2013 | US$ 510.057.778 | US$ 768.657.972 |
| 2012 | US$ 3.323.599.815 | US$ 677.182.760 |
| 2011 | US$ 7.806.911.230 | US$ 1.880.811.089 |
| 2010 | US$ 9.244.998.120 | US$ 1.102.696.147 |
| 2009 | US$ 1.444.871.046 | US$ −360.197.701 |
| 2008 | US$ 14.837.770.104 | US$ 1.727.292.156 |
| 2007 | US$ 35.591.477.412 | US$ 2.601.486.958 |
| 2006 | US$ 25.035.392.674 | US$ 2.259.381.845 |
| 2005 | US$ 21.801.420.447 | US$ 1.292.550.784 |
| 2004 | US$ 7.469.040.205 | US$ 879.540.746 |
| 2003 | US$ 911.474.591 | US$ 217.398.840 |
| 2002 | US$ −497.796.508 | US$ 660.790.498 |
| 2001 | US$ 416.889.166 | US$ 442.400.000 |
| 2000 | US$ 743.185.325 | US$ 380.272.500 |
| 1999 | US$ 667.032.818 | US$ 564.537.500 |
| 1998 | US$ 323.284.766 | US$ 918.775.000 |
| 1997 | US$ 136.993.957 | US$ 362.287.500 |
| 1996 | US$ 312.996.147 | US$ 152.400.000 |
| 1995 | US$ 392.188.547 | US$ 72.557.500 |
| 1994 | US$ 151.693.045 | US$ 31.304.838 |
| 1993 | US$ 56.441.543 | US$ 30.175.187 |
| 1992 | US$ 84.694.336 | US$ 10.000.000 |
| 1991 | US$ 90.037.665 | - |
| 1990 | US$ 30.019.824 | - |
| 1989 | US$ 51.651.040 | - |
| 1988 | US$ 40.803.168 | - |
| 1987 | US$ 19.392.653 | - |
| 1986 | US$ 21.883.369 | - |
| 1985 | US$ 18.970.276 | - |
| 1984 | US$ 26.245.343 | - |
| 1983 | US$ 24.511.552 | - |
| 1982 | US$ 20.866.569 | - |
| 1981 | US$ 39.048.274 | - |
| 1980 | US$ 26.633.728 | - |
| 1979 | US$ 16.179.876 | - |
| 1978 | US$ 21.536.998 | - |
| 1977 | US$ 18.469.881 | - |
| 1976 | US$ 14.113.136 | - |
| 1975 | US$ 15.853.078 | - |
| 1974 | US$ 10.636.044 | - |
| 1973 | US$ 5.151.890 | - |
| 1972 | US$ 4.455.199 | - |
| 1971 | US$ 11.544.861 | - |
| 1970 | US$ 11.600.000 | - |
Em 2025, as entradas líquidas de investimento estrangeiro direto foram de US$ 14,4 bilhões em Malta e de US$ 3,09 bilhões na Lituânia: 4,7 vezes mais em Malta. Em 1992, foram de US$ 84,7 milhões em Malta e de US$ 10 milhões na Lituânia.
As entradas líquidas de investimento estrangeiro direto em Malta foram maiores que na Lituânia em 28 dos 34 anos de 1992 a 2025, e menores em 6.
Malta vs Lituânia: entradas e saídas mais recentes de investimento estrangeiro
|
Malta
|
Lituânia
|
|
|---|---|---|
| Entradas líquidas | +US$ 14,4 bi | +US$ 3,09 bi |
| Entradas líquidas, % do PIB | +51,7% | +3,2% |
| Saídas líquidas | +US$ 11,4 bi | +US$ 128 mi |
| Entradas líquidas, total 2016–2025 | +US$ 371 bi | +US$ 28,4 bi |
| Posição mundial | 29/192 | 57/192 |
Comparar o investimento estrangeiro direto de 2 países quaisquer
Fontes:
- Banco Mundial | Financial Sector (1970–2025, atualizado em outubro de 2026)
Creative Commons Atribuição (CC BY): você pode copiar, compartilhar, adaptar e reutilizar este conteúdo, inclusive para fins comerciais, desde que cite o statistics.wiki e indique as alterações que fizer. As fontes listadas acima podem ter suas próprias condições de licença.