
Venezuela vs Portugal: exportações de alimentos e produtos agrícolas, 2001–2025 (inclui couros e peles)
| Ano | Exportações | |
|---|---|---|
 Venezuela |
 Portugal |
|
| 2025 | - | US$ 13.321.554.000 |
| 2024 | - | US$ 12.262.994.000 |
| 2023 | - | US$ 11.746.103.000 |
| 2022 | - | US$ 10.818.189.000 |
| 2021 | - | US$ 10.163.347.000 |
| 2020 | - | US$ 8.627.562.000 |
| 2019 | - | US$ 8.289.426.000 |
| 2018 | - | US$ 9.266.951.000 |
| 2017 | - | US$ 7.907.707.000 |
| 2016 | - | US$ 7.161.731.000 |
| 2015 | - | US$ 7.015.825.000 |
| 2014 | - | US$ 8.096.008.000 |
| 2013 | US$ 71.639.000 | US$ 7.532.724.000 |
| 2012 | US$ 498.000 | US$ 6.793.371.000 |
| 2011 | US$ 73.761.000 | US$ 6.929.835.000 |
| 2010 | US$ 154.180.000 | US$ 5.891.097.000 |
| 2009 | US$ 97.503.000 | US$ 5.653.054.000 |
| 2008 | US$ 160.628.000 | US$ 6.262.634.000 |
| 2007 | US$ 207.269.000 | US$ 5.083.287.000 |
| 2006 | US$ 131.014.000 | US$ 3.978.142.000 |
| 2005 | US$ 291.089.000 | US$ 3.410.194.000 |
| 2004 | US$ 357.347.000 | US$ 2.974.952.000 |
| 2003 | US$ 295.177.000 | US$ 2.535.738.000 |
| 2002 | US$ 432.479.000 | US$ 2.089.539.000 |
| 2001 | US$ 473.974.000 | US$ 1.816.694.000 |
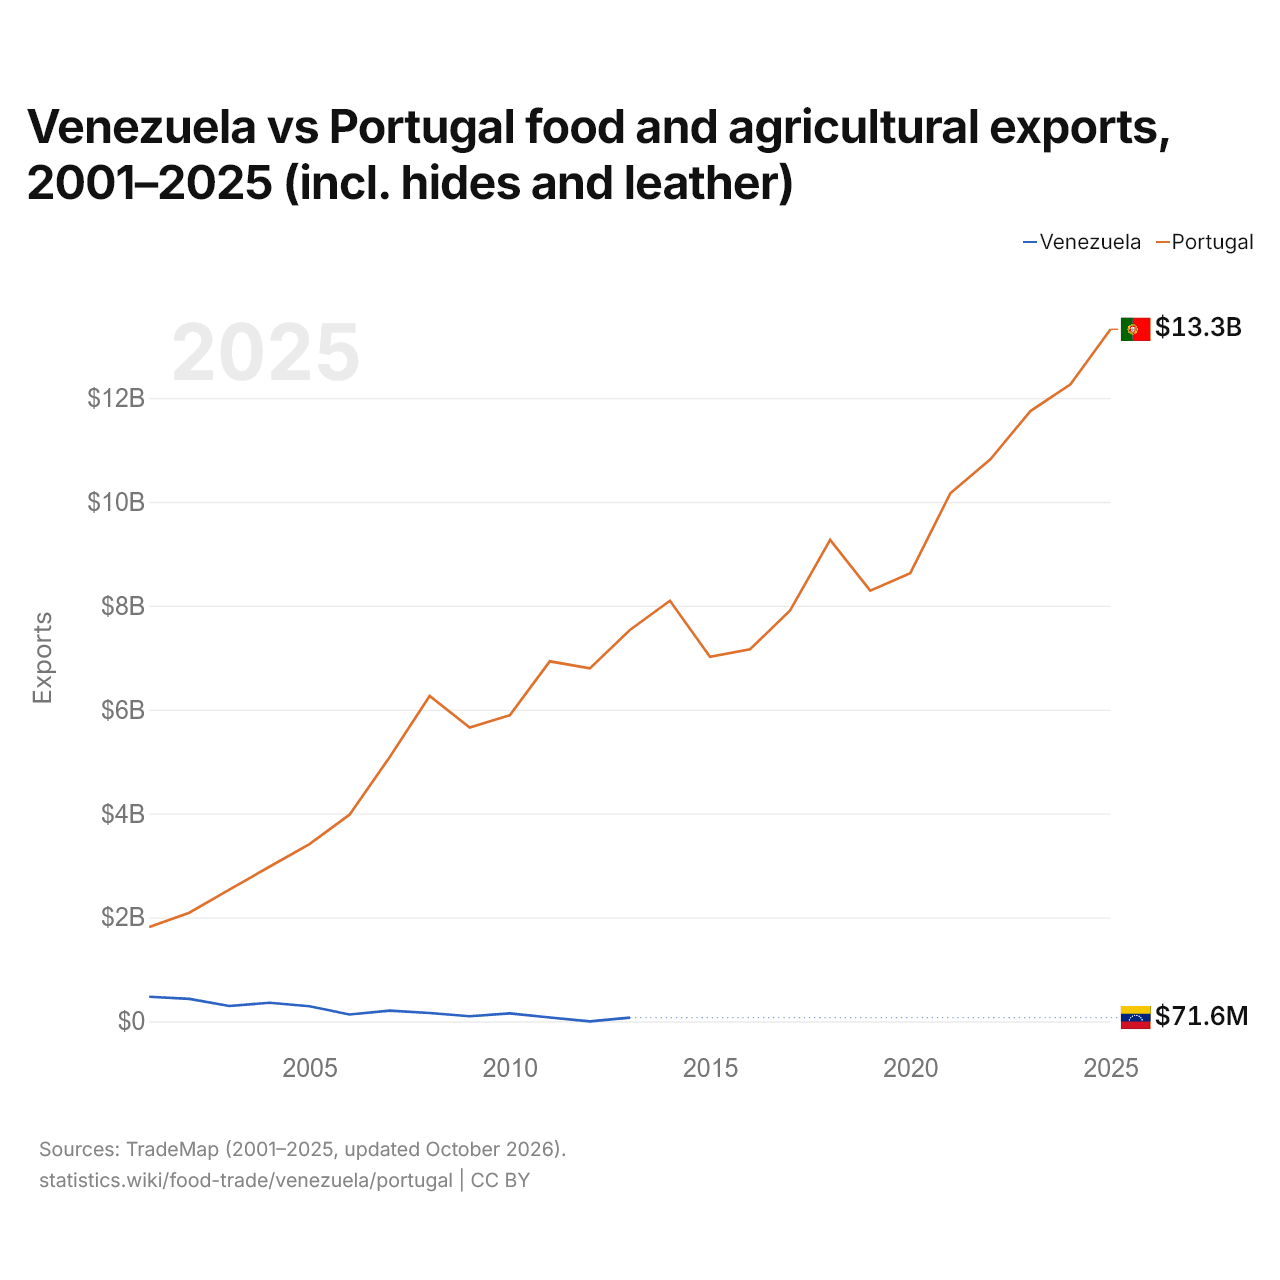
As exportações de alimentos e produtos agrícolas da Venezuela são de US$ 71,6 milhões (2013), e as de Portugal, de US$ 13,3 bilhões (2025). Em 2001, as exportações de Portugal foram 3,8 vezes maiores: US$ 474 milhões da Venezuela e US$ 1,82 bilhão de Portugal.
As exportações de alimentos e produtos agrícolas de Portugal têm sido maiores que as da Venezuela todos os anos desde 2001.
Venezuela vs Portugal: importações de alimentos e produtos agrícolas, 2001–2025
| Ano | Importações | |
|---|---|---|
|
Venezuela
|
Portugal
|
|
| 2025 | - | US$ 20.869.984.000 |
| 2024 | - | US$ 17.896.901.000 |
| 2023 | - | US$ 18.175.391.000 |
| 2022 | - | US$ 16.887.507.000 |
| 2021 | - | US$ 14.716.705.000 |
| 2020 | - | US$ 12.674.690.000 |
| 2019 | - | US$ 13.042.731.000 |
| 2018 | - | US$ 14.509.184.000 |
| 2017 | - | US$ 12.542.186.000 |
| 2016 | - | US$ 11.249.707.000 |
| 2015 | - | US$ 10.899.039.000 |
| 2014 | - | US$ 12.484.488.000 |
| 2013 | US$ 9.770.298.000 | US$ 12.681.908.000 |
| 2012 | US$ 9.418.650.000 | US$ 11.733.750.000 |
| 2011 | US$ 7.778.566.000 | US$ 13.000.888.000 |
| 2010 | US$ 5.099.728.000 | US$ 11.331.092.000 |
| 2009 | US$ 6.432.652.000 | US$ 11.078.644.000 |
| 2008 | US$ 8.186.991.000 | US$ 12.618.691.000 |
| 2007 | US$ 4.507.925.000 | US$ 10.800.941.000 |
| 2006 | US$ 2.376.842.000 | US$ 8.776.034.000 |
| 2005 | US$ 2.225.551.000 | US$ 7.993.337.000 |
| 2004 | US$ 2.225.253.000 | US$ 7.571.456.000 |
| 2003 | US$ 1.471.760.000 | US$ 6.537.977.000 |
| 2002 | US$ 1.513.704.000 | US$ 5.527.585.000 |
| 2001 | US$ 1.956.733.000 | US$ 5.342.287.000 |
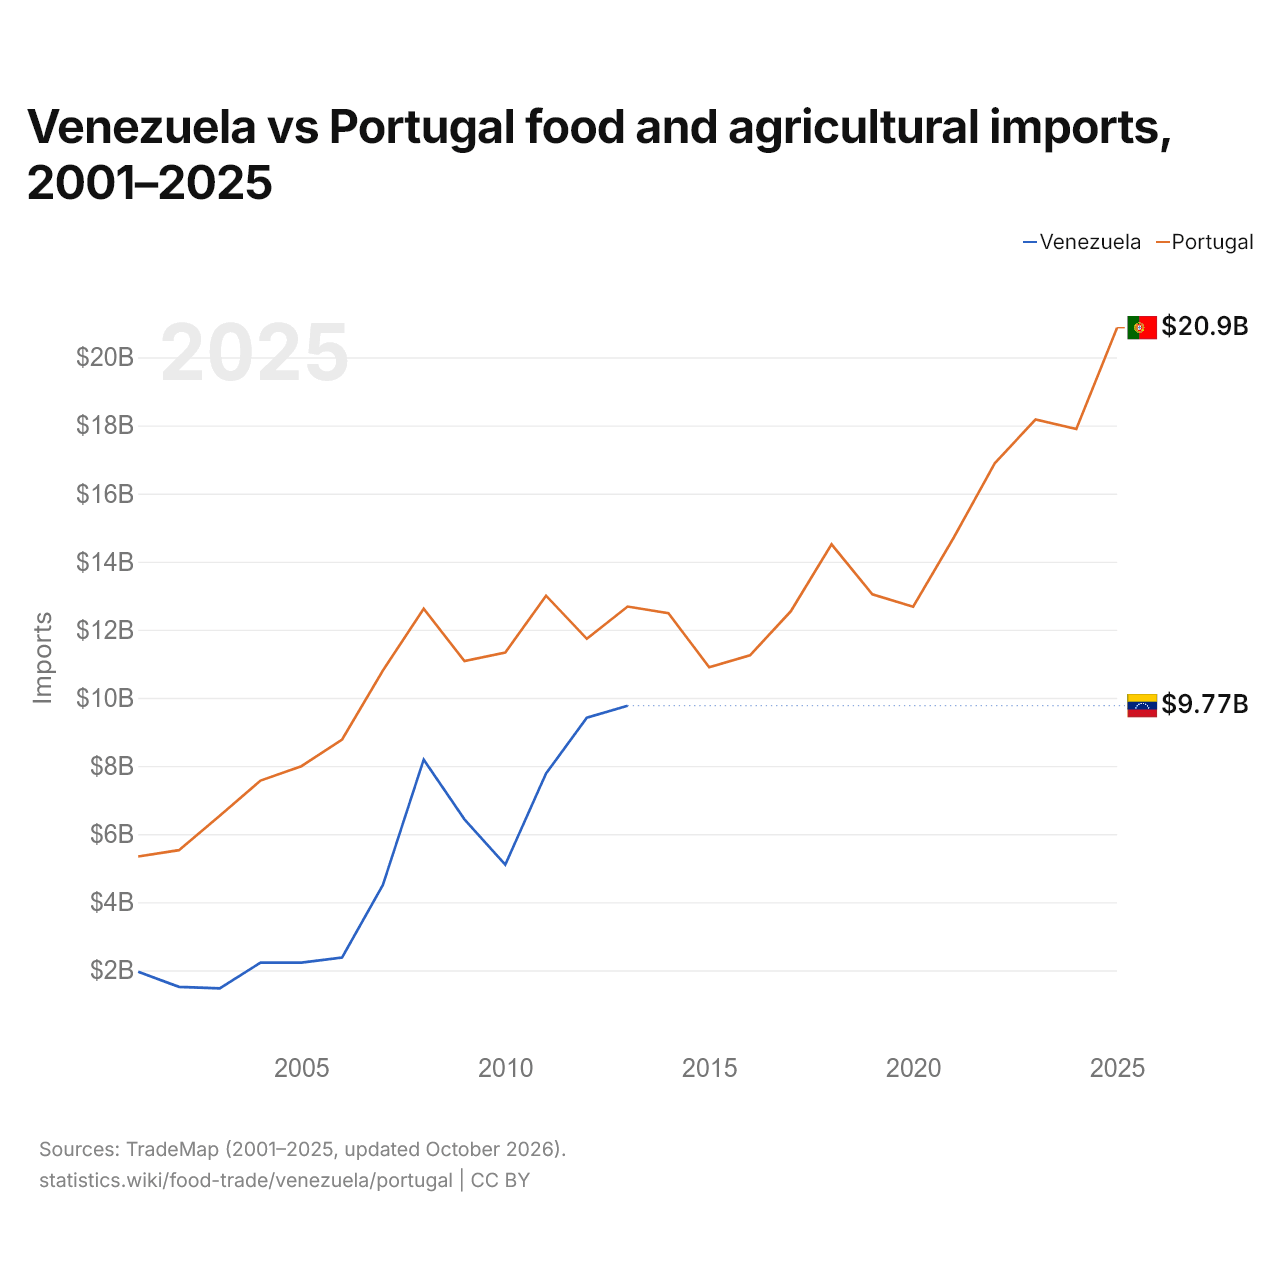
As importações de alimentos e produtos agrícolas da Venezuela são de US$ 9,77 bilhões (2013), e as de Portugal, de US$ 20,9 bilhões (2025). Em 2001, as importações de Portugal foram 2,7 vezes maiores: US$ 1,96 bilhão da Venezuela e US$ 5,34 bilhões de Portugal.
Venezuela vs Portugal: dados do comércio de alimentos e produtos agrícolas
|
Venezuela
|
Portugal
|
|
|---|---|---|
| Exportações | US$ 71,6 mi (2013) | US$ 13,3 bi (2025) |
| Importações | US$ 9,77 bi (2013) | US$ 20,9 bi (2025) |
| Saldo | -US$ 9,70 bi (2013) | -US$ 7,55 bi (2025) |
| Participação mundial | 0,005% | 0,59% |
| Posição mundial | n/d | 40/171 |
| Principal comprador | Itália (14,1%, 2013) | Espanha (40,1%, 2025) |
| Principal fornecedor | Brasil (23,8%, 2013) | Espanha (46,5%, 2025) |
Comparar o comércio de alimentos e produtos agrícolas de 2 países quaisquer
Fontes:
- TradeMap (2001–2025, atualizado em outubro de 2026)
Creative Commons Atribuição (CC BY): você pode copiar, compartilhar, adaptar e reutilizar este conteúdo, inclusive para fins comerciais, desde que cite o statistics.wiki e indique as alterações que fizer. As fontes listadas acima podem ter suas próprias condições de licença.