
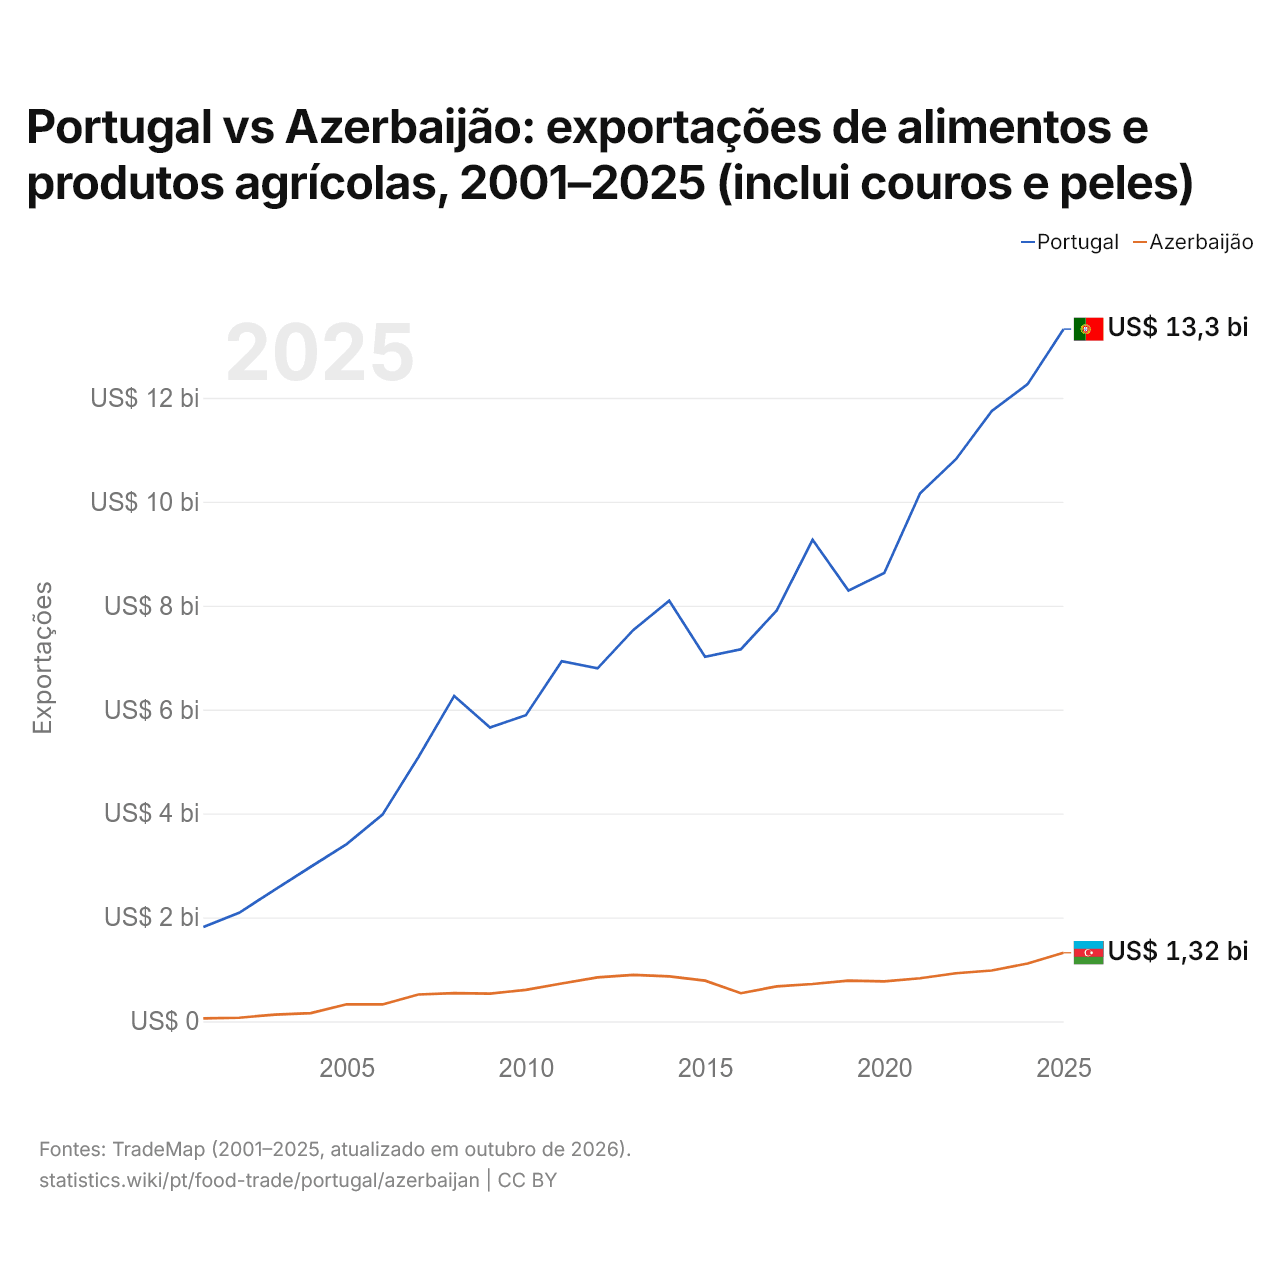
Portugal vs Azerbaijão: exportações de alimentos e produtos agrícolas, 2001–2025 (inclui couros e peles)
| Ano | Exportações | |
|---|---|---|
 Portugal |
 Azerbaijão |
|
| 2025 | US$ 13.321.554.000 | US$ 1.319.761.000 |
| 2024 | US$ 12.262.994.000 | US$ 1.113.577.000 |
| 2023 | US$ 11.746.103.000 | US$ 977.571.000 |
| 2022 | US$ 10.818.189.000 | US$ 925.401.000 |
| 2021 | US$ 10.163.347.000 | US$ 828.317.000 |
| 2020 | US$ 8.627.562.000 | US$ 768.211.000 |
| 2019 | US$ 8.289.426.000 | US$ 783.839.000 |
| 2018 | US$ 9.266.951.000 | US$ 717.621.000 |
| 2017 | US$ 7.907.707.000 | US$ 673.890.000 |
| 2016 | US$ 7.161.731.000 | US$ 540.614.000 |
| 2015 | US$ 7.015.825.000 | US$ 782.638.000 |
| 2014 | US$ 8.096.008.000 | US$ 864.863.000 |
| 2013 | US$ 7.532.724.000 | US$ 895.416.000 |
| 2012 | US$ 6.793.371.000 | US$ 846.226.000 |
| 2011 | US$ 6.929.835.000 | US$ 728.088.000 |
| 2010 | US$ 5.891.097.000 | US$ 605.118.000 |
| 2009 | US$ 5.653.054.000 | US$ 533.918.000 |
| 2008 | US$ 6.262.634.000 | US$ 543.554.000 |
| 2007 | US$ 5.083.287.000 | US$ 517.208.000 |
| 2006 | US$ 3.978.142.000 | US$ 325.395.000 |
| 2005 | US$ 3.410.194.000 | US$ 329.096.000 |
| 2004 | US$ 2.974.952.000 | US$ 158.585.000 |
| 2003 | US$ 2.535.738.000 | US$ 130.291.000 |
| 2002 | US$ 2.089.539.000 | US$ 69.298.000 |
| 2001 | US$ 1.816.694.000 | US$ 57.100.000 |
Em 2025, as exportações de alimentos e produtos agrícolas de Portugal foram de US$ 13,3 bilhões e as do Azerbaijão, de US$ 1,32 bilhão: as de Portugal foram 10 vezes maiores. Em 2001, as exportações de Portugal foram 32 vezes maiores: US$ 1,82 bilhão de Portugal e US$ 57,1 milhões do Azerbaijão.
As exportações de alimentos e produtos agrícolas de Portugal têm sido maiores que as do Azerbaijão todos os anos desde 2001.
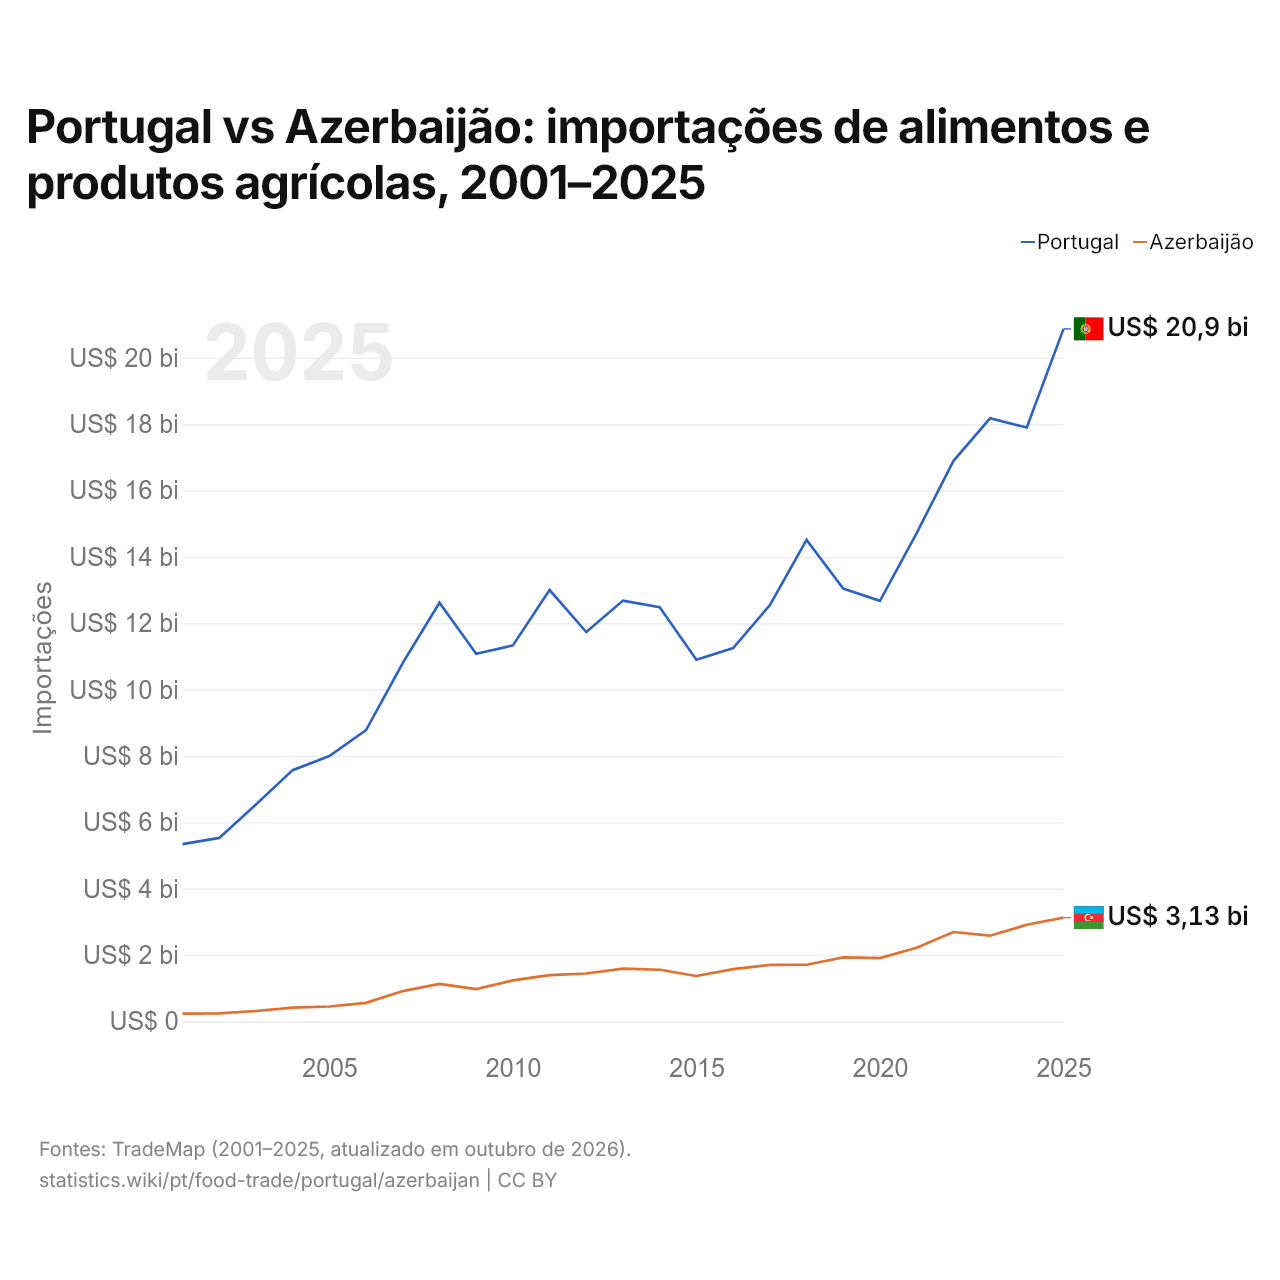
Portugal vs Azerbaijão: importações de alimentos e produtos agrícolas, 2001–2025
| Ano | Importações | |
|---|---|---|
|
Portugal
|
Azerbaijão
|
|
| 2025 | US$ 20.869.984.000 | US$ 3.127.028.000 |
| 2024 | US$ 17.896.901.000 | US$ 2.909.407.000 |
| 2023 | US$ 18.175.391.000 | US$ 2.581.940.000 |
| 2022 | US$ 16.887.507.000 | US$ 2.692.145.000 |
| 2021 | US$ 14.716.705.000 | US$ 2.215.413.000 |
| 2020 | US$ 12.674.690.000 | US$ 1.904.247.000 |
| 2019 | US$ 13.042.731.000 | US$ 1.926.661.000 |
| 2018 | US$ 14.509.184.000 | US$ 1.704.831.000 |
| 2017 | US$ 12.542.186.000 | US$ 1.700.104.000 |
| 2016 | US$ 11.249.707.000 | US$ 1.574.994.000 |
| 2015 | US$ 10.899.039.000 | US$ 1.366.103.000 |
| 2014 | US$ 12.484.488.000 | US$ 1.553.888.000 |
| 2013 | US$ 12.681.908.000 | US$ 1.589.285.000 |
| 2012 | US$ 11.733.750.000 | US$ 1.442.459.000 |
| 2011 | US$ 13.000.888.000 | US$ 1.393.108.000 |
| 2010 | US$ 11.331.092.000 | US$ 1.233.757.000 |
| 2009 | US$ 11.078.644.000 | US$ 971.613.000 |
| 2008 | US$ 12.618.691.000 | US$ 1.130.546.000 |
| 2007 | US$ 10.800.941.000 | US$ 911.540.000 |
| 2006 | US$ 8.776.034.000 | US$ 556.775.000 |
| 2005 | US$ 7.993.337.000 | US$ 447.578.000 |
| 2004 | US$ 7.571.456.000 | US$ 414.603.000 |
| 2003 | US$ 6.537.977.000 | US$ 311.192.000 |
| 2002 | US$ 5.527.585.000 | US$ 238.159.000 |
| 2001 | US$ 5.342.287.000 | US$ 234.091.000 |
Em 2025, as importações de alimentos e produtos agrícolas de Portugal foram de US$ 20,9 bilhões e as do Azerbaijão, de US$ 3,13 bilhões: as de Portugal foram 6,7 vezes maiores. Em 2001, as importações de Portugal foram 23 vezes maiores: US$ 5,34 bilhões de Portugal e US$ 234 milhões do Azerbaijão.
Portugal vs Azerbaijão: dados do comércio de alimentos e produtos agrícolas
|
Portugal
|
Azerbaijão
|
|
|---|---|---|
| Exportações | US$ 13,3 bi (2025) | US$ 1,32 bi (2025) |
| Importações | US$ 20,9 bi (2025) | US$ 3,13 bi (2025) |
| Saldo | -US$ 7,55 bi (2025) | -US$ 1,81 bi (2025) |
| Participação mundial | 0,59% | 0,06% |
| Posição mundial | 40/171 | 96/171 |
| Principal comprador | Espanha (40,1%, 2025) | Rússia (61,8%, 2025) |
| Principal fornecedor | Espanha (46,5%, 2025) | Rússia (26,8%, 2025) |
Comparar o comércio de alimentos e produtos agrícolas de 2 países quaisquer
Fontes:
- TradeMap (2001–2025, atualizado em outubro de 2026)
Creative Commons Atribuição (CC BY): você pode copiar, compartilhar, adaptar e reutilizar este conteúdo, inclusive para fins comerciais, desde que cite o statistics.wiki e indique as alterações que fizer. As fontes listadas acima podem ter suas próprias condições de licença.