
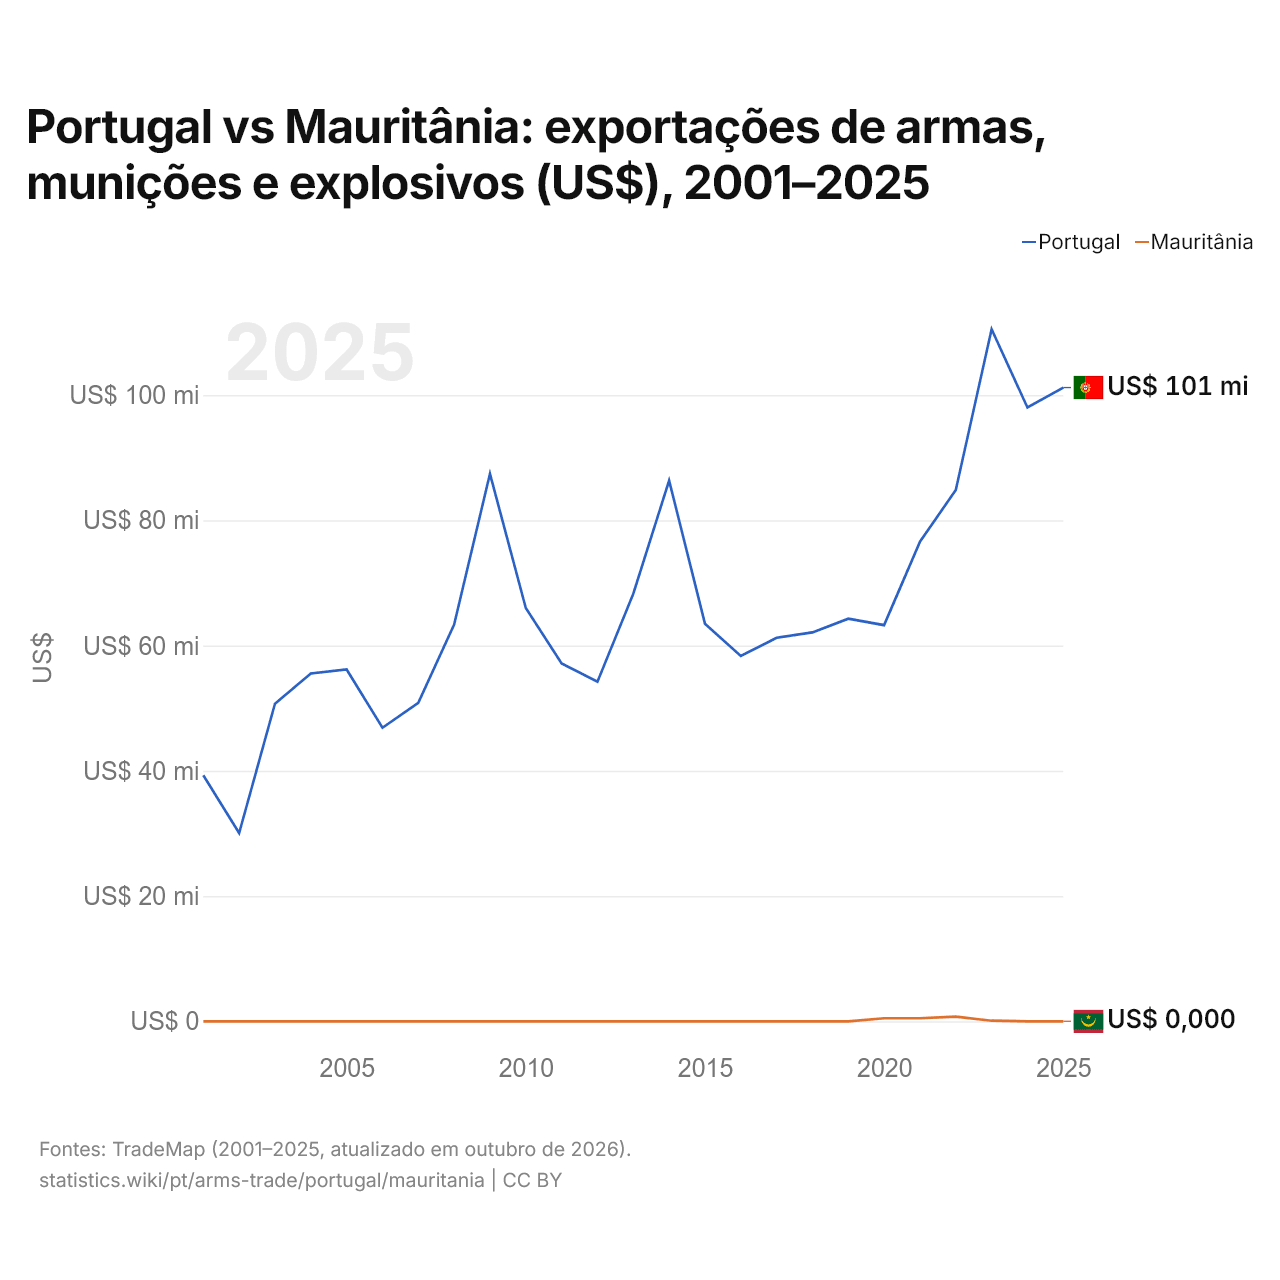
Portugal vs Mauritânia: exportações de armas, munições e explosivos (US$), 2001–2025
| Ano | US$ | |
|---|---|---|
 Portugal |
 Mauritânia |
|
| 2025 | US$ 101.204.000 | US$ 0 |
| 2024 | US$ 98.020.000 | US$ 0 |
| 2023 | US$ 110.511.000 | US$ 100.000 |
| 2022 | US$ 84.853.000 | US$ 739.000 |
| 2021 | US$ 76.577.000 | US$ 490.000 |
| 2020 | US$ 63.266.000 | US$ 496.000 |
| 2019 | US$ 64.293.000 | US$ 0 |
| 2018 | US$ 62.108.000 | US$ 2.000 |
| 2017 | US$ 61.257.000 | US$ 0 |
| 2016 | US$ 58.344.000 | US$ 0 |
| 2015 | US$ 63.494.000 | US$ 0 |
| 2014 | US$ 86.355.000 | US$ 0 |
| 2013 | US$ 68.280.000 | US$ 0 |
| 2012 | US$ 54.237.000 | US$ 0 |
| 2011 | US$ 57.157.000 | US$ 0 |
| 2010 | US$ 66.003.000 | US$ 0 |
| 2009 | US$ 87.433.000 | US$ 0 |
| 2008 | US$ 63.373.000 | US$ 0 |
| 2007 | US$ 50.871.000 | US$ 0 |
| 2006 | US$ 46.879.000 | US$ 0 |
| 2005 | US$ 56.185.000 | US$ 0 |
| 2004 | US$ 55.556.000 | US$ 0 |
| 2003 | US$ 50.712.000 | US$ 0 |
| 2002 | US$ 30.066.000 | US$ 0 |
| 2001 | US$ 39.288.000 | US$ 0 |
Em 2025, as exportações de armas e munições de Portugal foram de US$ 101 milhões e as da Mauritânia, de US$ 0. Em 2001, as de Portugal foram de US$ 39,3 milhões e as da Mauritânia, de US$ 0.
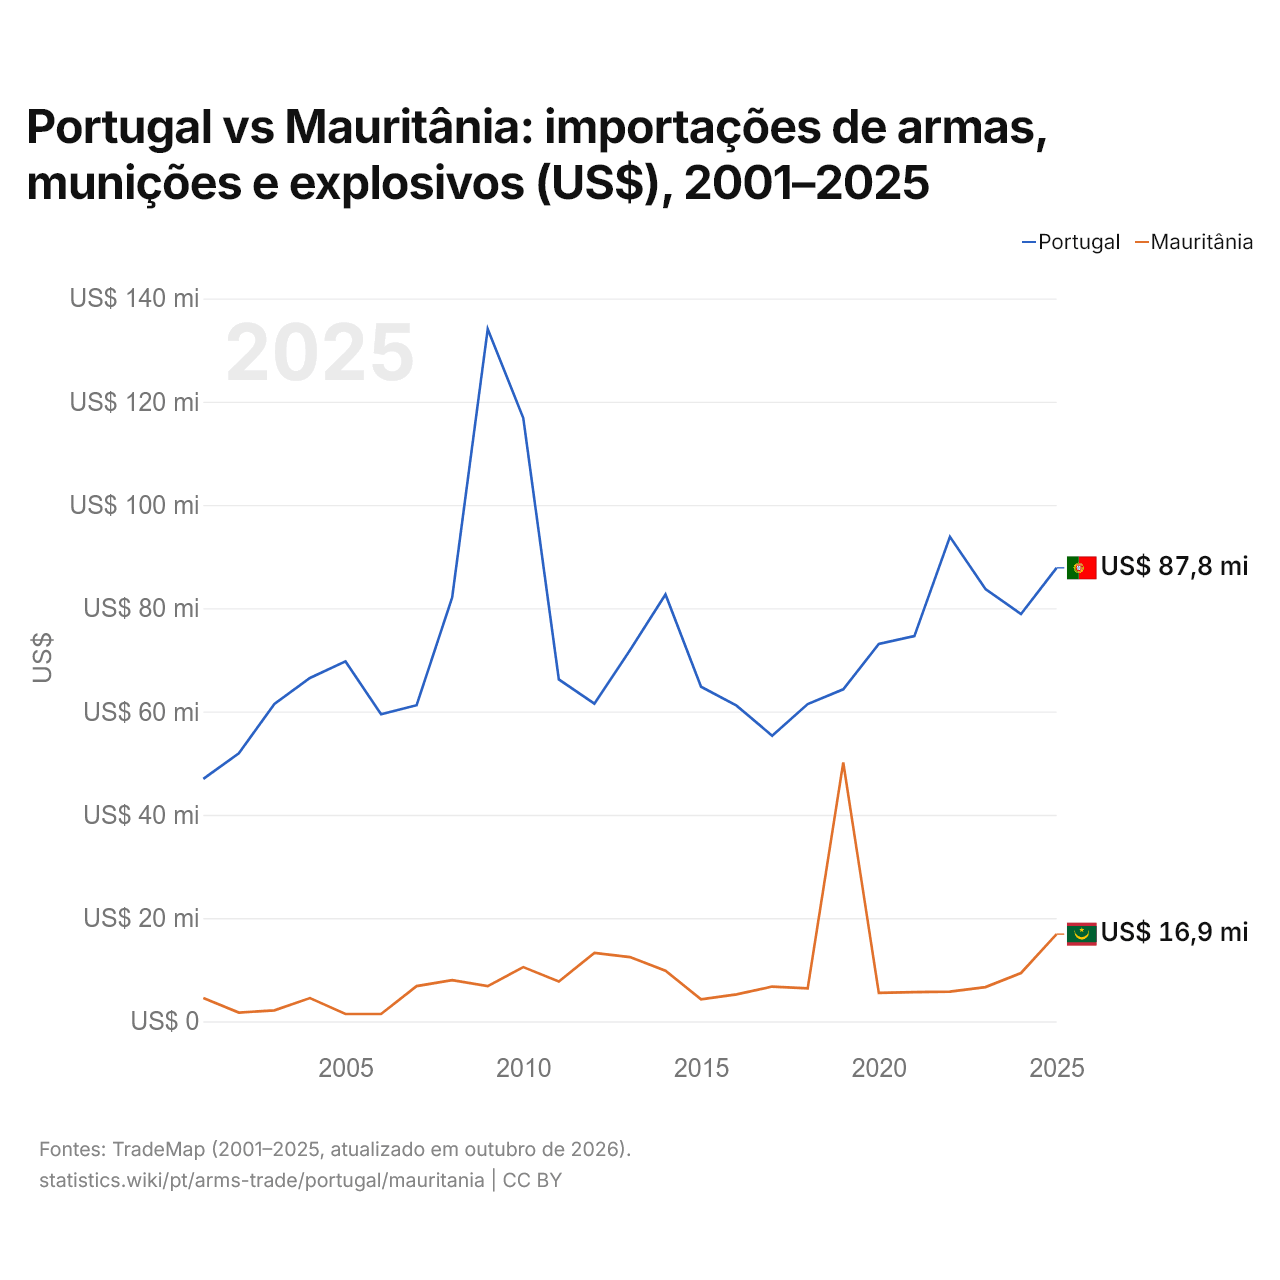
Portugal vs Mauritânia: importações de armas, munições e explosivos (US$), 2001–2025
| Ano | US$ | |
|---|---|---|
|
Portugal
|
Mauritânia
|
|
| 2025 | US$ 87.831.000 | US$ 16.893.000 |
| 2024 | US$ 78.878.000 | US$ 9.359.000 |
| 2023 | US$ 83.734.000 | US$ 6.635.000 |
| 2022 | US$ 93.847.000 | US$ 5.765.000 |
| 2021 | US$ 74.596.000 | US$ 5.656.000 |
| 2020 | US$ 73.084.000 | US$ 5.519.000 |
| 2019 | US$ 64.295.000 | US$ 50.140.000 |
| 2018 | US$ 61.448.000 | US$ 6.399.000 |
| 2017 | US$ 55.318.000 | US$ 6.733.000 |
| 2016 | US$ 61.136.000 | US$ 5.219.000 |
| 2015 | US$ 64.797.000 | US$ 4.257.000 |
| 2014 | US$ 82.680.000 | US$ 9.809.000 |
| 2013 | US$ 71.883.000 | US$ 12.437.000 |
| 2012 | US$ 61.511.000 | US$ 13.268.000 |
| 2011 | US$ 66.215.000 | US$ 7.700.000 |
| 2010 | US$ 116.836.000 | US$ 10.501.000 |
| 2009 | US$ 134.105.000 | US$ 6.812.000 |
| 2008 | US$ 82.091.000 | US$ 7.977.000 |
| 2007 | US$ 61.226.000 | US$ 6.827.000 |
| 2006 | US$ 59.468.000 | US$ 1.426.000 |
| 2005 | US$ 69.717.000 | US$ 1.426.000 |
| 2004 | US$ 66.512.000 | US$ 4.505.000 |
| 2003 | US$ 61.471.000 | US$ 2.131.000 |
| 2002 | US$ 51.914.000 | US$ 1.690.000 |
| 2001 | US$ 46.945.000 | US$ 4.516.000 |
Em 2025, as importações de armas e munições de Portugal foram de US$ 87,8 milhões e as da Mauritânia, de US$ 16,9 milhões: as de Portugal foram 5,2 vezes maiores. Em 2001, as de Portugal foram de US$ 46,9 milhões e as da Mauritânia, de US$ 4,52 milhões; as de Portugal, 10 vezes maiores.
Portugal vs Mauritânia: dados do comércio de armas e munições
|
Portugal
|
Mauritânia
|
|
|---|---|---|
| Exportações | US$ 101 mi (2025) | US$ 0 (2025) |
| Importações | US$ 87,8 mi (2025) | US$ 16,9 mi (2025) |
| Participação mundial | 0,2% | 0% |
| Posição mundial | 36/170 | 141/170 |
| Principal comprador | Estados Unidos (65,3%, 2025) | Marrocos (86%, 2023) |
| Principal fornecedor | Espanha (11,3%, 2025) | China (55,1%, 2025) |
Comparar o comércio de armas e munições de 2 países quaisquer
Fontes:
- TradeMap (2001–2025, atualizado em outubro de 2026)
Creative Commons Atribuição (CC BY): você pode copiar, compartilhar, adaptar e reutilizar este conteúdo, inclusive para fins comerciais, desde que cite o statistics.wiki e indique as alterações que fizer. As fontes listadas acima podem ter suas próprias condições de licença.