
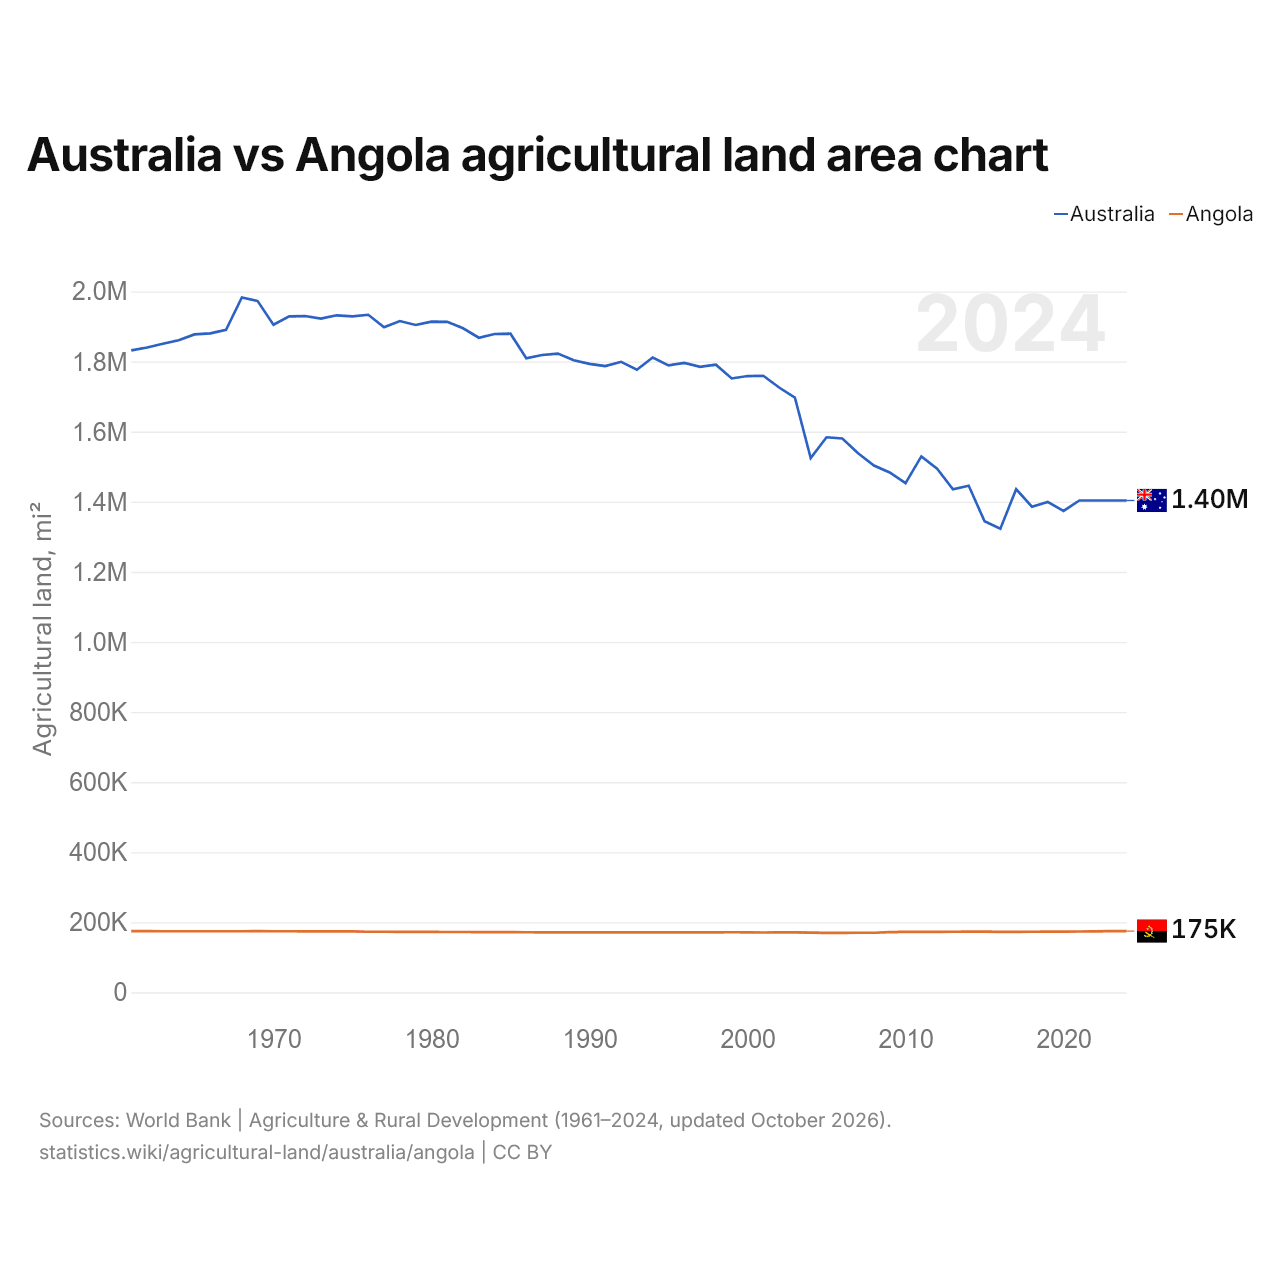
Austrália vs Angola: gráfico da área de terras agrícolas
| Ano | Terras agrícolas, km² | |
|---|---|---|
| Austrália | Angola | |
| 2024 | 3.635.190 | 452.854 |
| 2023 | 3.635.190 | 452.787 |
| 2022 | 3.635.190 | 450.693 |
| 2021 | 3.635.190 | 449.726 |
| 2020 | 3.557.750 | 449.263 |
| 2019 | 3.624.770 | 448.784 |
| 2018 | 3.588.950 | 447.646 |
| 2017 | 3.718.370 | 447.061 |
| 2016 | 3.426.020 | 447.306 |
| 2015 | 3.481.190 | 448.814 |
| 2014 | 3.744.230 | 448.192 |
| 2013 | 3.717.750 | 447.602 |
| 2012 | 3.870.760 | 446.878 |
| 2011 | 3.961.210 | 446.536 |
| 2010 | 3.763.720 | 446.490 |
| 2009 | 3.842.570 | 444.410 |
| 2008 | 3.892.880 | 440.081 |
| 2007 | 3.983.555 | 440.596 |
| 2006 | 4.093.020 | 439.523 |
| 2005 | 4.102.300 | 439.978 |
| 2004 | 3.949.060 | 441.256 |
| 2003 | 4.395.000 | 443.142 |
| 2002 | 4.470.000 | 442.514 |
| 2001 | 4.557.000 | 442.277 |
| 2000 | 4.554.690 | 443.346 |
| 1999 | 4.536.930 | 443.772 |
| 1998 | 4.638.810 | 443.242 |
| 1997 | 4.622.330 | 442.614 |
| 1996 | 4.652.300 | 442.589 |
| 1995 | 4.633.880 | 443.020 |
| 1994 | 4.691.430 | 443.218 |
| 1993 | 4.600.970 | 443.220 |
| 1992 | 4.660.040 | 443.222 |
| 1991 | 4.627.820 | 443.007 |
| 1990 | 4.644.370 | 442.793 |
| 1989 | 4.671.040 | 443.078 |
| 1988 | 4.720.520 | 443.364 |
| 1987 | 4.710.200 | 443.649 |
| 1986 | 4.685.410 | 443.934 |
| 1985 | 4.867.910 | 444.820 |
| 1984 | 4.865.580 | 445.105 |
| 1983 | 4.837.890 | 445.441 |
| 1982 | 4.907.720 | 445.776 |
| 1981 | 4.955.650 | 446.062 |
| 1980 | 4.956.380 | 446.497 |
| 1979 | 4.932.380 | 446.832 |
| 1978 | 4.961.000 | 447.218 |
| 1977 | 4.915.100 | 447.503 |
| 1976 | 5.007.420 | 447.789 |
| 1975 | 4.995.470 | 450.074 |
| 1974 | 5.003.570 | 450.360 |
| 1973 | 4.978.970 | 450.645 |
| 1972 | 4.998.150 | 450.930 |
| 1971 | 4.995.362 | 451.216 |
| 1970 | 4.934.325 | 451.501 |
| 1969 | 5.108.880 | 451.787 |
| 1968 | 5.135.696 | 451.672 |
| 1967 | 4.895.806 | 451.657 |
| 1966 | 4.870.285 | 451.643 |
| 1965 | 4.862.592 | 451.628 |
| 1964 | 4.819.038 | 451.714 |
| 1963 | 4.793.696 | 451.699 |
| 1962 | 4.765.929 | 451.785 |
| 1961 | 4.744.844 | 451.770 |
As terras agrícolas ocupam 3.635.190 km² (1.403.555 mi²) na Austrália e 452.854 km² (174.848 mi²) em Angola: a área agrícola da Austrália é 8,0 vezes a de Angola. Em 1961, ocupavam 4.744.844 km² (1.831.995 mi²) na Austrália e 451.770 km² (174.429 mi²) em Angola; a área agrícola da Austrália era então 11 vezes a de Angola.
As terras agrícolas ocupam 47,3% da área terrestre da Austrália e 36,3% da área de Angola; as terras aráveis, 4,1% e 3,7%.
Austrália vs Angola: terras agrícolas, área e % da área terrestre
 Austrália |
 Angola |
|
|---|---|---|
| Terras agrícolas | 3.635.190 km² | 452.854 km² |
| Terras agrícolas, % | 47,3% | 36,3% |
| Terras aráveis | 312.650 km² | 45.673 km² |
| Terras aráveis, % | 4,1% | 3,7% |
| Culturas permanentes | 3.850 km² | 3.571 km² |
| Culturas permanentes, % | 0,1% | 0,3% |
| Prados e pastagens | 3.318.690 km² | 403.610 km² |
| Prados e pastagens, % | 43,2% | 32,4% |
| Terras aráveis por pessoa | 1,15 ha por pessoa | 0,12 ha por pessoa |
| Posição mundial por terras agrícolas | 3º de 194 | 20º de 194 |
| Posição mundial por terras aráveis | 10º de 191 | 51º de 191 |
| Posição mundial por terras aráveis por pessoa | 2º de 191 | 96º de 191 |
Comparar as terras agrícolas de 2 países quaisquer
Fontes:
- Banco Mundial | Agriculture & Rural Development (1961–2024, atualizado em outubro de 2026)
Creative Commons Atribuição (CC BY): você pode copiar, compartilhar, adaptar e reutilizar este conteúdo, inclusive para fins comerciais, desde que cite o statistics.wiki e indique as alterações que fizer. As fontes listadas acima podem ter suas próprias condições de licença.