
Curacao vs Barbados: population by age and sex, 1950–2100
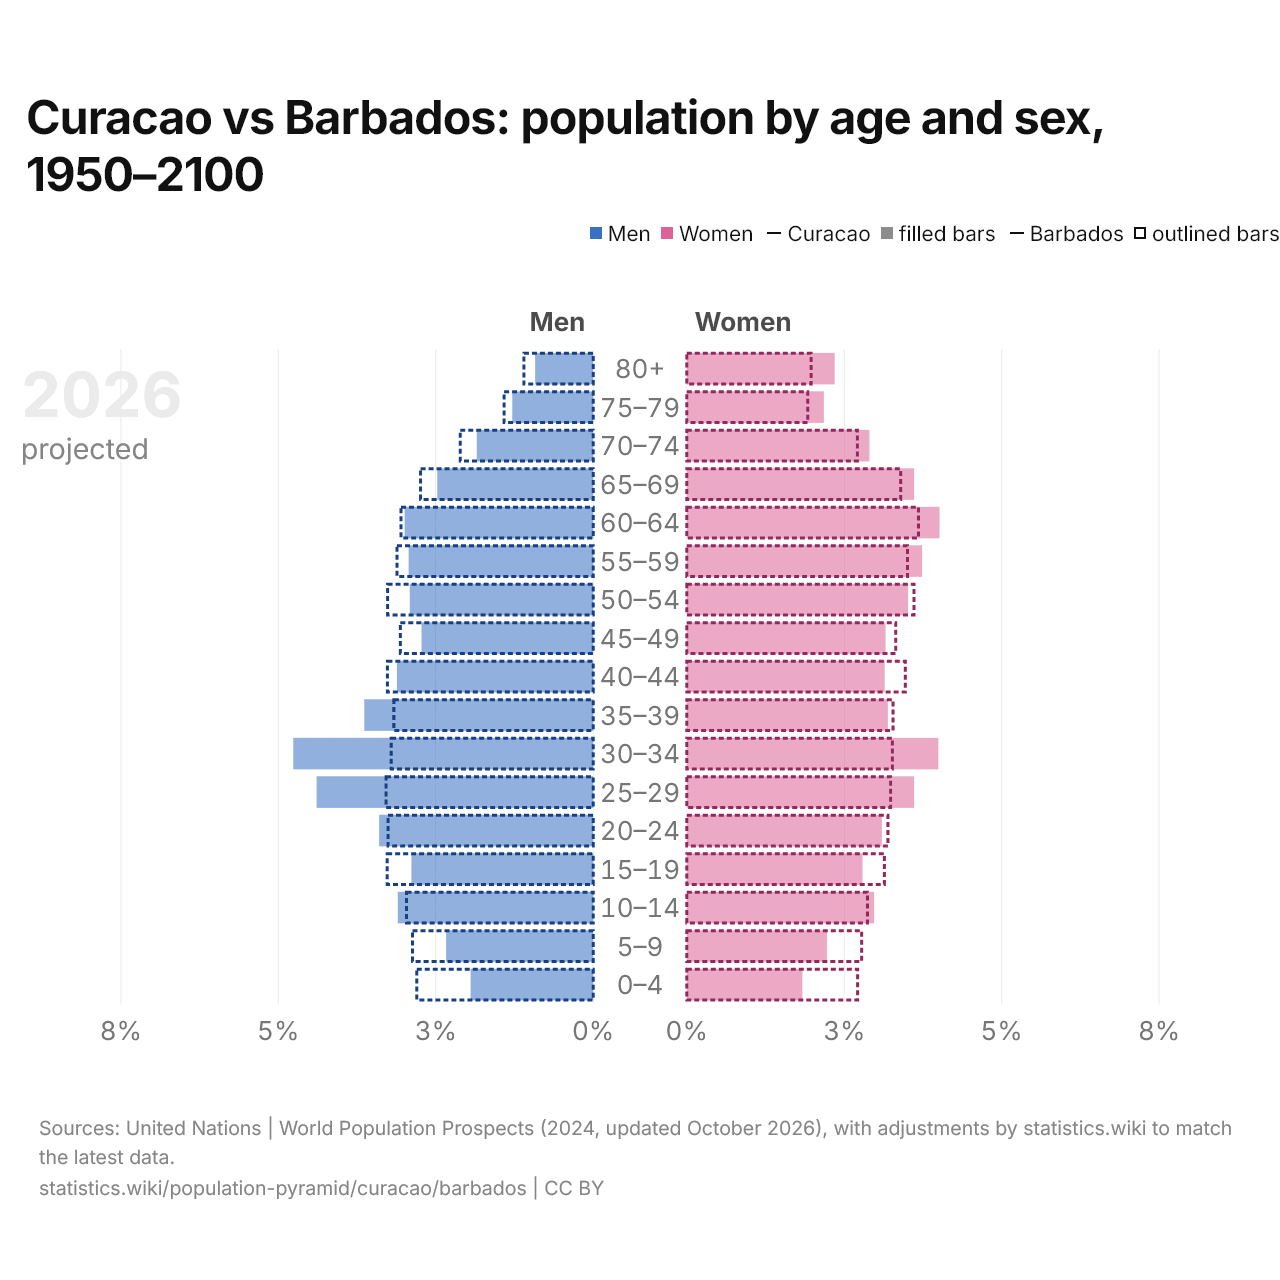
| Age (2026 projected) | Men, % of population | Women, % of population | ||
|---|---|---|---|---|
| Curacao | Barbados | Curacao | Barbados | |
| 80+ | 0.9% | 1.1% | 2.3% | 2.0% |
| 75–79 | 1.3% | 1.4% | 2.2% | 1.9% |
| 70–74 | 1.8% | 2.1% | 2.9% | 2.7% |
| 65–69 | 2.5% | 2.7% | 3.6% | 3.4% |
| 60–64 | 3.0% | 3.1% | 4.0% | 3.7% |
| 55–59 | 2.9% | 3.1% | 3.7% | 3.5% |
| 50–54 | 2.9% | 3.3% | 3.5% | 3.6% |
| 45–49 | 2.7% | 3.1% | 3.2% | 3.3% |
| 40–44 | 3.1% | 3.3% | 3.1% | 3.5% |
| 35–39 | 3.6% | 3.2% | 3.2% | 3.3% |
| 30–34 | 4.8% | 3.2% | 4.0% | 3.3% |
| 25–29 | 4.4% | 3.3% | 3.6% | 3.2% |
| 20–24 | 3.4% | 3.3% | 3.1% | 3.2% |
| 15–19 | 2.9% | 3.3% | 2.8% | 3.1% |
| 10–14 | 3.1% | 3.0% | 3.0% | 2.9% |
| 5–9 | 2.3% | 2.9% | 2.2% | 2.8% |
| 0–4 | 1.9% | 2.8% | 1.8% | 2.7% |
In 2026, children aged 0–14 make up 14.4% of Curacao's population and 17.0% of Barbados': 2.6 percentage points more in Barbados. People aged 65 and over make up 17.6% of the population in Curacao and 17.4% in Barbados, 0.2 points more in Curacao. The largest age group is 30–34 in Curacao and 50–54 in Barbados.
Curacao vs Barbados: age structure in 2026
 Curacao |
 Barbados |
|
|---|---|---|
| Aged 0–14 | 14.4% | 17.0% |
| Aged 15–64 | 68.0% | 65.6% |
| Aged 65+ | 17.6% | 17.4% |
| Median age | 39.9 | 40.5 |
| Men per 100 women | 91.1 | 92.1 |
Curacao vs Barbados: population pyramids by year, 1950–2100
- Men Women
- Curacao filled bars
- Barbados outlined bars
1950
2000
2050 (projected)
2100 (projected)
In 1950, children aged 0–14 made up 37.3% of Curacao's population and 36.4% of Barbados', and people aged 65 and over 5.1% and 5.3%. By 2100, children are projected to make up 10.0% and 12.9%, and people aged 65 and over 35.5% and 32.7%.
Curacao vs Barbados: how the age structure changes, 1950–2100
| Measure | 1950 | 2000 | 2026 projected | 2050 projected | 2100 projected |
|---|---|---|---|---|---|
| Aged 0–14 | |||||
| Curacao |
37.3% | 26.7% | 14.4% | 11.4% | 10.0% |
| Barbados |
36.4% | 22.0% | 17.0% | 14.9% | 12.9% |
| Aged 15–64 | |||||
| Curacao |
57.6% | 64.3% | 68.0% | 64.8% | 54.5% |
| Barbados |
58.3% | 66.7% | 65.6% | 60.8% | 54.4% |
| Aged 65+ | |||||
| Curacao |
5.1% | 9.0% | 17.6% | 23.8% | 35.5% |
| Barbados |
5.3% | 11.3% | 17.4% | 24.3% | 32.7% |
| Median age | |||||
| Curacao |
22.0 | 33.4 | 39.9 | 48.1 | 53.9 |
| Barbados |
22.9 | 33.3 | 40.5 | 45.3 | 51.0 |
| Men per 100 women | |||||
| Curacao |
95.1 | 87.6 | 91.1 | 101.0 | 119.9 |
| Barbados |
85.8 | 92.7 | 92.1 | 93.5 | 99.2 |
Compare the population pyramids of any 2 countries
Sources:
- United Nations | World Population Prospects (1950–2100, updated October 2026), with adjustments by statistics.wiki to match the latest data
Creative Commons Attribution (CC BY): you may copy, share, adapt and reuse this content, also commercially, as long as you credit statistics.wiki and note any changes you made. The sources listed above may have their own license terms.