
Lithuania vs Latvia: adult mortality and probability of dying by age, UN life tables, 2026 (projected)


Of people aged 15, 13.9% in Lithuania and 13.7% in Latvia would die before reaching 60: 20.1% and 19.7% of men, 7.3% and 7.6% of women.
Lithuania vs Latvia: probability of dying within a year by age, UN life tables, 2026 (projected)
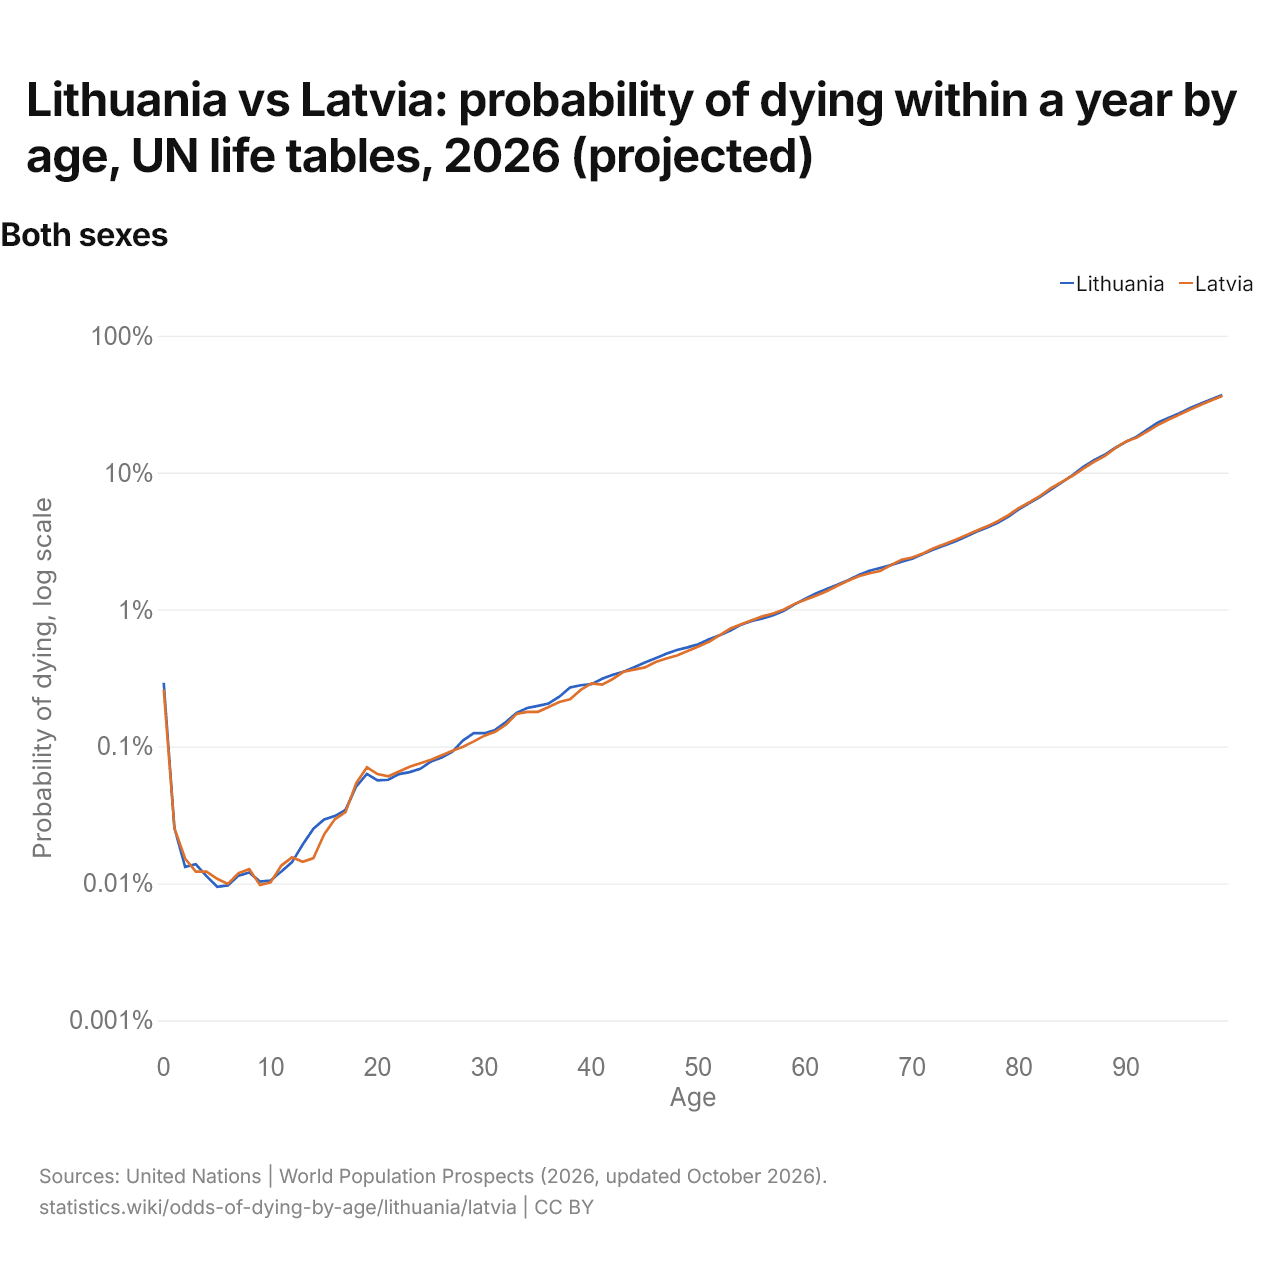
| Age | Probability of dying, log scale | |
|---|---|---|
| Lithuania | Latvia | |
| 0 | 0.292% | 0.26% |
| 1 | 0.025% | 0.025% |
| 2 | 0.013% | 0.015% |
| 3 | 0.014% | 0.012% |
| 4 | 0.011% | 0.012% |
| 5 | 0.009% | 0.011% |
| 6 | 0.01% | 0.01% |
| 7 | 0.011% | 0.012% |
| 8 | 0.012% | 0.013% |
| 9 | 0.01% | 0.01% |
| 10 | 0.011% | 0.01% |
| 11 | 0.012% | 0.013% |
| 12 | 0.014% | 0.015% |
| 13 | 0.019% | 0.014% |
| 14 | 0.025% | 0.015% |
| 15 | 0.029% | 0.023% |
| 16 | 0.031% | 0.029% |
| 17 | 0.034% | 0.033% |
| 18 | 0.051% | 0.054% |
| 19 | 0.063% | 0.07% |
| 20 | 0.057% | 0.063% |
| 21 | 0.057% | 0.061% |
| 22 | 0.063% | 0.066% |
| 23 | 0.065% | 0.071% |
| 24 | 0.069% | 0.075% |
| 25 | 0.078% | 0.08% |
| 26 | 0.083% | 0.086% |
| 27 | 0.092% | 0.093% |
| 28 | 0.111% | 0.1% |
| 29 | 0.125% | 0.109% |
| 30 | 0.125% | 0.12% |
| 31 | 0.132% | 0.128% |
| 32 | 0.151% | 0.144% |
| 33 | 0.176% | 0.173% |
| 34 | 0.191% | 0.179% |
| 35 | 0.198% | 0.179% |
| 36 | 0.206% | 0.194% |
| 37 | 0.231% | 0.211% |
| 38 | 0.27% | 0.221% |
| 39 | 0.28% | 0.259% |
| 40 | 0.285% | 0.289% |
| 41 | 0.312% | 0.283% |
| 42 | 0.334% | 0.311% |
| 43 | 0.351% | 0.351% |
| 44 | 0.379% | 0.364% |
| 45 | 0.411% | 0.378% |
| 46 | 0.441% | 0.414% |
| 47 | 0.475% | 0.439% |
| 48 | 0.507% | 0.461% |
| 49 | 0.529% | 0.497% |
| 50 | 0.558% | 0.538% |
| 51 | 0.607% | 0.581% |
| 52 | 0.65% | 0.651% |
| 53 | 0.701% | 0.726% |
| 54 | 0.776% | 0.782% |
| 55 | 0.826% | 0.836% |
| 56 | 0.86% | 0.891% |
| 57 | 0.907% | 0.936% |
| 58 | 0.98% | 1% |
| 59 | 1.09% | 1.1% |
| 60 | 1.2% | 1.18% |
| 61 | 1.31% | 1.26% |
| 62 | 1.41% | 1.36% |
| 63 | 1.52% | 1.49% |
| 64 | 1.64% | 1.62% |
| 65 | 1.79% | 1.75% |
| 66 | 1.92% | 1.84% |
| 67 | 2.01% | 1.91% |
| 68 | 2.11% | 2.11% |
| 69 | 2.23% | 2.31% |
| 70 | 2.35% | 2.4% |
| 71 | 2.54% | 2.57% |
| 72 | 2.74% | 2.8% |
| 73 | 2.93% | 3% |
| 74 | 3.14% | 3.22% |
| 75 | 3.4% | 3.48% |
| 76 | 3.69% | 3.76% |
| 77 | 3.98% | 4.05% |
| 78 | 4.3% | 4.41% |
| 79 | 4.77% | 4.89% |
| 80 | 5.41% | 5.53% |
| 81 | 6.01% | 6.1% |
| 82 | 6.69% | 6.79% |
| 83 | 7.54% | 7.72% |
| 84 | 8.47% | 8.55% |
| 85 | 9.6% | 9.48% |
| 86 | 11% | 10.7% |
| 87 | 12.3% | 12% |
| 88 | 13.5% | 13.2% |
| 89 | 15.2% | 15.1% |
| 90 | 16.8% | 16.9% |
| 91 | 18.3% | 18% |
| 92 | 20.7% | 20% |
| 93 | 23.2% | 22.3% |
| 94 | 25.2% | 24.4% |
| 95 | 27.1% | 26.5% |
| 96 | 29.6% | 28.9% |
| 97 | 32% | 31.3% |
| 98 | 34.4% | 33.7% |
| 99 | 36.9% | 36.2% |
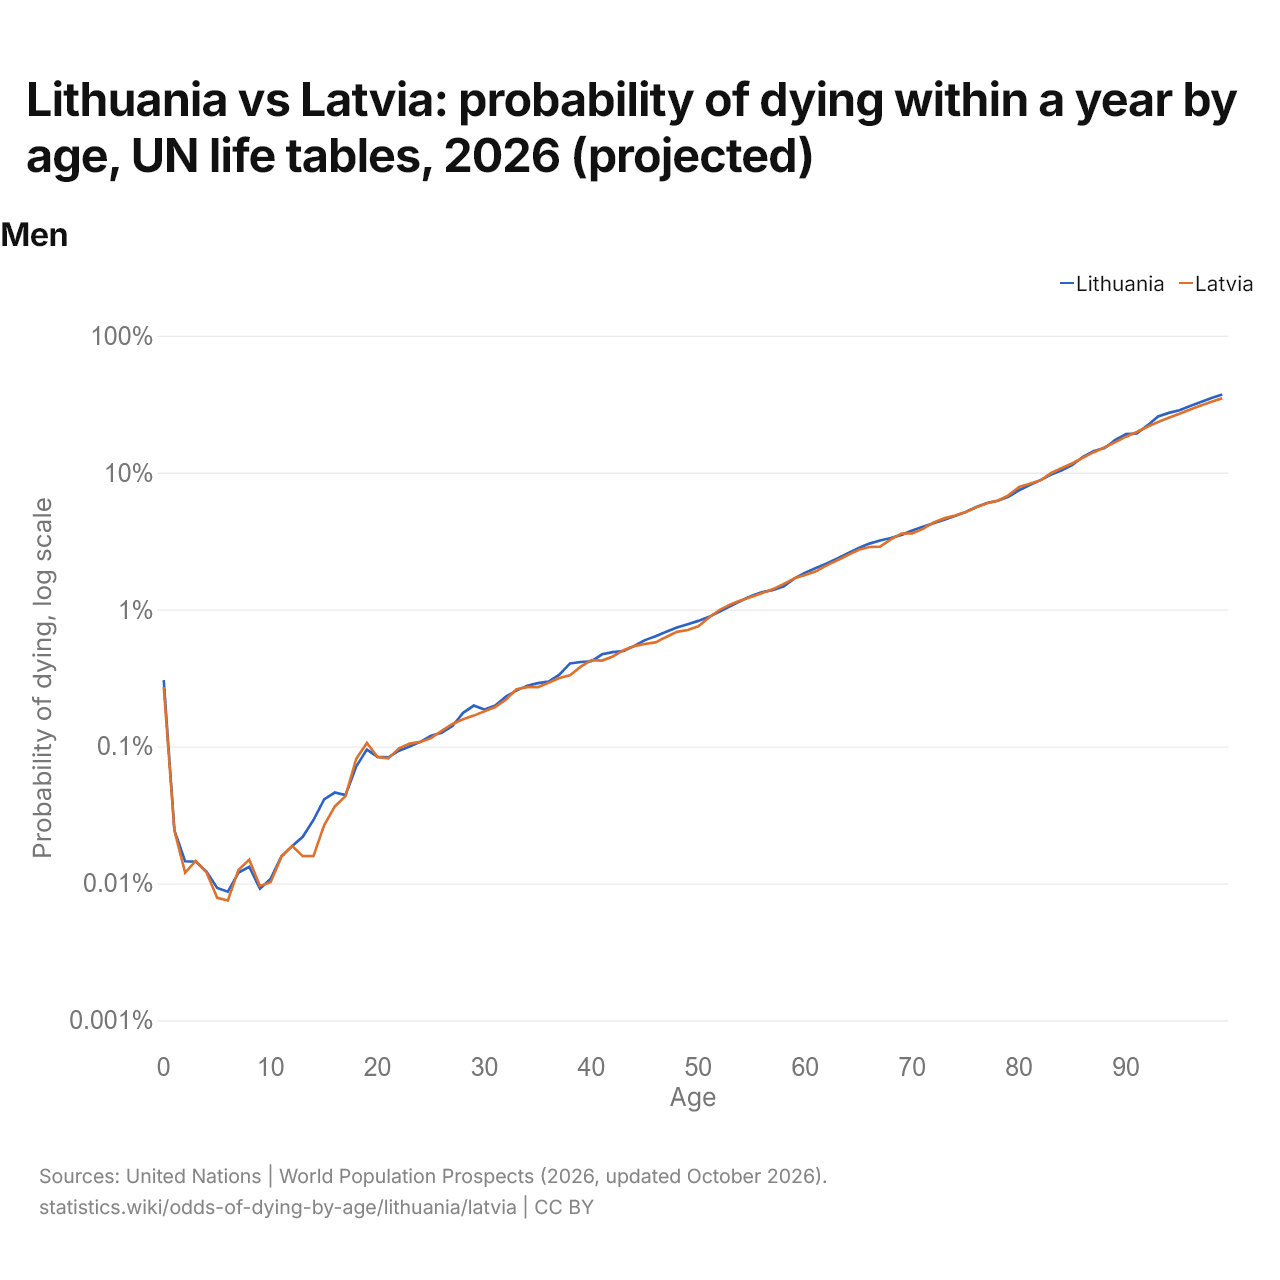
| Age | Probability of dying, log scale | |
|---|---|---|
| Lithuania | Latvia | |
| 0 | 0.305% | 0.271% |
| 1 | 0.024% | 0.024% |
| 2 | 0.015% | 0.012% |
| 3 | 0.014% | 0.015% |
| 4 | 0.012% | 0.012% |
| 5 | 0.009% | 0.008% |
| 6 | 0.009% | 0.008% |
| 7 | 0.012% | 0.013% |
| 8 | 0.013% | 0.015% |
| 9 | 0.009% | 0.01% |
| 10 | 0.011% | 0.01% |
| 11 | 0.016% | 0.016% |
| 12 | 0.019% | 0.019% |
| 13 | 0.022% | 0.016% |
| 14 | 0.029% | 0.016% |
| 15 | 0.041% | 0.027% |
| 16 | 0.046% | 0.036% |
| 17 | 0.044% | 0.043% |
| 18 | 0.071% | 0.081% |
| 19 | 0.095% | 0.106% |
| 20 | 0.084% | 0.084% |
| 21 | 0.083% | 0.082% |
| 22 | 0.093% | 0.097% |
| 23 | 0.1% | 0.105% |
| 24 | 0.108% | 0.108% |
| 25 | 0.12% | 0.115% |
| 26 | 0.126% | 0.13% |
| 27 | 0.141% | 0.146% |
| 28 | 0.176% | 0.158% |
| 29 | 0.199% | 0.168% |
| 30 | 0.186% | 0.181% |
| 31 | 0.199% | 0.194% |
| 32 | 0.231% | 0.22% |
| 33 | 0.257% | 0.262% |
| 34 | 0.278% | 0.271% |
| 35 | 0.29% | 0.271% |
| 36 | 0.298% | 0.292% |
| 37 | 0.334% | 0.316% |
| 38 | 0.404% | 0.331% |
| 39 | 0.414% | 0.383% |
| 40 | 0.419% | 0.427% |
| 41 | 0.471% | 0.424% |
| 42 | 0.489% | 0.454% |
| 43 | 0.498% | 0.505% |
| 44 | 0.542% | 0.541% |
| 45 | 0.598% | 0.56% |
| 46 | 0.638% | 0.576% |
| 47 | 0.687% | 0.631% |
| 48 | 0.739% | 0.687% |
| 49 | 0.782% | 0.708% |
| 50 | 0.826% | 0.754% |
| 51 | 0.884% | 0.875% |
| 52 | 0.967% | 0.994% |
| 53 | 1.06% | 1.09% |
| 54 | 1.16% | 1.17% |
| 55 | 1.26% | 1.24% |
| 56 | 1.34% | 1.32% |
| 57 | 1.39% | 1.41% |
| 58 | 1.48% | 1.54% |
| 59 | 1.69% | 1.69% |
| 60 | 1.86% | 1.79% |
| 61 | 2.01% | 1.9% |
| 62 | 2.17% | 2.1% |
| 63 | 2.36% | 2.29% |
| 64 | 2.58% | 2.5% |
| 65 | 2.81% | 2.73% |
| 66 | 3.03% | 2.86% |
| 67 | 3.19% | 2.88% |
| 68 | 3.33% | 3.25% |
| 69 | 3.51% | 3.59% |
| 70 | 3.77% | 3.6% |
| 71 | 4.02% | 3.88% |
| 72 | 4.26% | 4.32% |
| 73 | 4.53% | 4.63% |
| 74 | 4.82% | 4.86% |
| 75 | 5.16% | 5.15% |
| 76 | 5.61% | 5.58% |
| 77 | 6% | 5.97% |
| 78 | 6.23% | 6.24% |
| 79 | 6.65% | 6.82% |
| 80 | 7.44% | 7.84% |
| 81 | 8.11% | 8.3% |
| 82 | 8.81% | 8.79% |
| 83 | 9.67% | 9.93% |
| 84 | 10.4% | 10.8% |
| 85 | 11.4% | 11.7% |
| 86 | 13.1% | 12.9% |
| 87 | 14.4% | 14.1% |
| 88 | 15.1% | 15.3% |
| 89 | 17.3% | 16.7% |
| 90 | 19.1% | 18.3% |
| 91 | 19.3% | 19.8% |
| 92 | 22.1% | 21.6% |
| 93 | 25.7% | 23.4% |
| 94 | 27.3% | 25.1% |
| 95 | 28.5% | 26.9% |
| 96 | 30.6% | 28.9% |
| 97 | 32.8% | 30.9% |
| 98 | 35% | 32.9% |
| 99 | 37.2% | 34.9% |
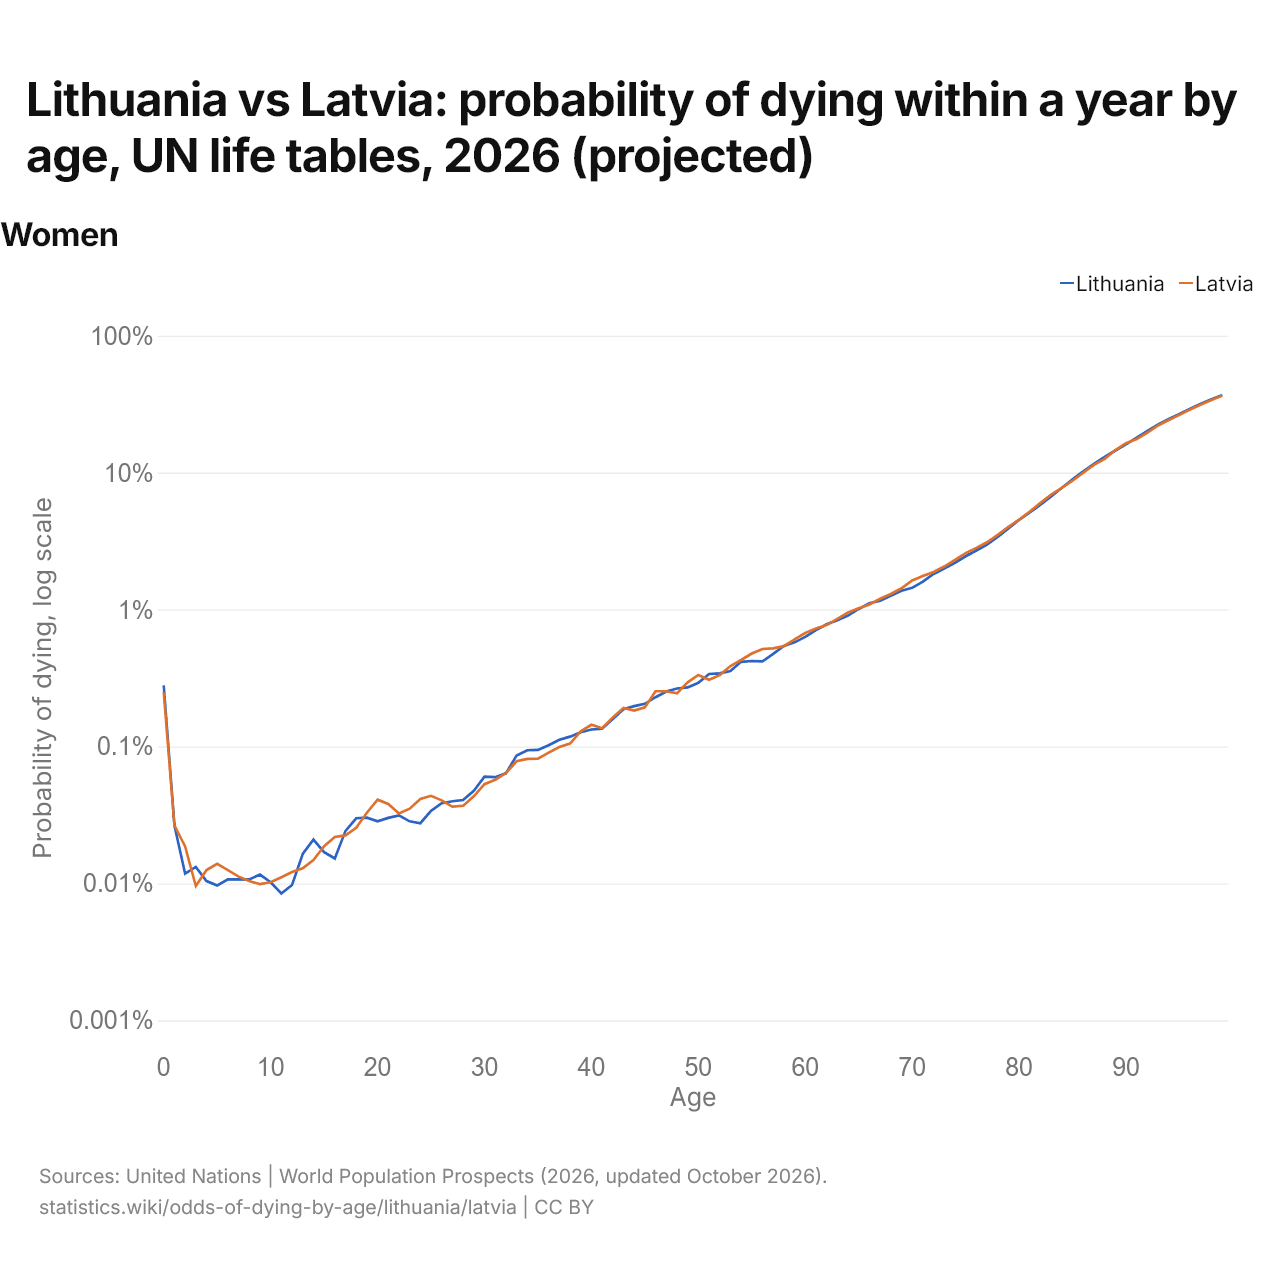
| Age | Probability of dying, log scale | |
|---|---|---|
| Lithuania | Latvia | |
| 0 | 0.279% | 0.248% |
| 1 | 0.026% | 0.026% |
| 2 | 0.012% | 0.019% |
| 3 | 0.013% | 0.01% |
| 4 | 0.01% | 0.013% |
| 5 | 0.01% | 0.014% |
| 6 | 0.011% | 0.013% |
| 7 | 0.011% | 0.011% |
| 8 | 0.011% | 0.01% |
| 9 | 0.012% | 0.01% |
| 10 | 0.01% | 0.01% |
| 11 | 0.008% | 0.011% |
| 12 | 0.01% | 0.012% |
| 13 | 0.016% | 0.013% |
| 14 | 0.021% | 0.015% |
| 15 | 0.017% | 0.019% |
| 16 | 0.015% | 0.022% |
| 17 | 0.024% | 0.022% |
| 18 | 0.03% | 0.025% |
| 19 | 0.03% | 0.033% |
| 20 | 0.028% | 0.041% |
| 21 | 0.03% | 0.038% |
| 22 | 0.031% | 0.032% |
| 23 | 0.028% | 0.035% |
| 24 | 0.028% | 0.041% |
| 25 | 0.034% | 0.044% |
| 26 | 0.038% | 0.04% |
| 27 | 0.04% | 0.036% |
| 28 | 0.041% | 0.037% |
| 29 | 0.047% | 0.043% |
| 30 | 0.06% | 0.053% |
| 31 | 0.06% | 0.057% |
| 32 | 0.064% | 0.064% |
| 33 | 0.086% | 0.078% |
| 34 | 0.094% | 0.081% |
| 35 | 0.094% | 0.081% |
| 36 | 0.102% | 0.09% |
| 37 | 0.112% | 0.099% |
| 38 | 0.118% | 0.105% |
| 39 | 0.127% | 0.129% |
| 40 | 0.133% | 0.144% |
| 41 | 0.135% | 0.136% |
| 42 | 0.159% | 0.163% |
| 43 | 0.187% | 0.191% |
| 44 | 0.197% | 0.183% |
| 45 | 0.205% | 0.193% |
| 46 | 0.229% | 0.253% |
| 47 | 0.252% | 0.253% |
| 48 | 0.265% | 0.244% |
| 49 | 0.27% | 0.294% |
| 50 | 0.292% | 0.333% |
| 51 | 0.338% | 0.307% |
| 52 | 0.342% | 0.332% |
| 53 | 0.355% | 0.387% |
| 54 | 0.415% | 0.428% |
| 55 | 0.421% | 0.477% |
| 56 | 0.418% | 0.515% |
| 57 | 0.474% | 0.521% |
| 58 | 0.542% | 0.54% |
| 59 | 0.576% | 0.605% |
| 60 | 0.631% | 0.674% |
| 61 | 0.707% | 0.727% |
| 62 | 0.781% | 0.77% |
| 63 | 0.834% | 0.855% |
| 64 | 0.903% | 0.951% |
| 65 | 1.01% | 1.02% |
| 66 | 1.11% | 1.09% |
| 67 | 1.16% | 1.2% |
| 68 | 1.26% | 1.3% |
| 69 | 1.37% | 1.43% |
| 70 | 1.44% | 1.63% |
| 71 | 1.6% | 1.76% |
| 72 | 1.82% | 1.88% |
| 73 | 1.99% | 2.06% |
| 74 | 2.19% | 2.3% |
| 75 | 2.45% | 2.58% |
| 76 | 2.7% | 2.82% |
| 77 | 2.98% | 3.1% |
| 78 | 3.39% | 3.51% |
| 79 | 3.91% | 4.01% |
| 80 | 4.51% | 4.54% |
| 81 | 5.12% | 5.2% |
| 82 | 5.82% | 6.01% |
| 83 | 6.7% | 6.9% |
| 84 | 7.75% | 7.74% |
| 85 | 8.93% | 8.72% |
| 86 | 10.2% | 10% |
| 87 | 11.6% | 11.4% |
| 88 | 13% | 12.6% |
| 89 | 14.5% | 14.6% |
| 90 | 16.1% | 16.4% |
| 91 | 18% | 17.6% |
| 92 | 20.2% | 19.6% |
| 93 | 22.5% | 22.1% |
| 94 | 24.6% | 24.2% |
| 95 | 26.8% | 26.4% |
| 96 | 29.3% | 28.9% |
| 97 | 31.8% | 31.4% |
| 98 | 34.3% | 33.9% |
| 99 | 36.8% | 36.5% |
In 2026, the risk of dying within a year is 0.29% at birth in Lithuania and 0.26% in Latvia; at 80, it is 5.4% and 5.5%.
Compare the odds of dying by age in any 2 countries
Sources:
- United Nations | World Population Prospects (2026, updated October 2026)
Creative Commons Attribution (CC BY): you may copy, share, adapt and reuse this content, also commercially, as long as you credit statistics.wiki and note any changes you made. The sources listed above may have their own license terms.