
Japan vs China: adult mortality and probability of dying by age, UN life tables, 2026 (projected)


Of people aged 15, 4.6% in Japan and 7.7% in China would die before reaching 60: 6.0% and 10.0% of men, 3.2% and 5.1% of women.
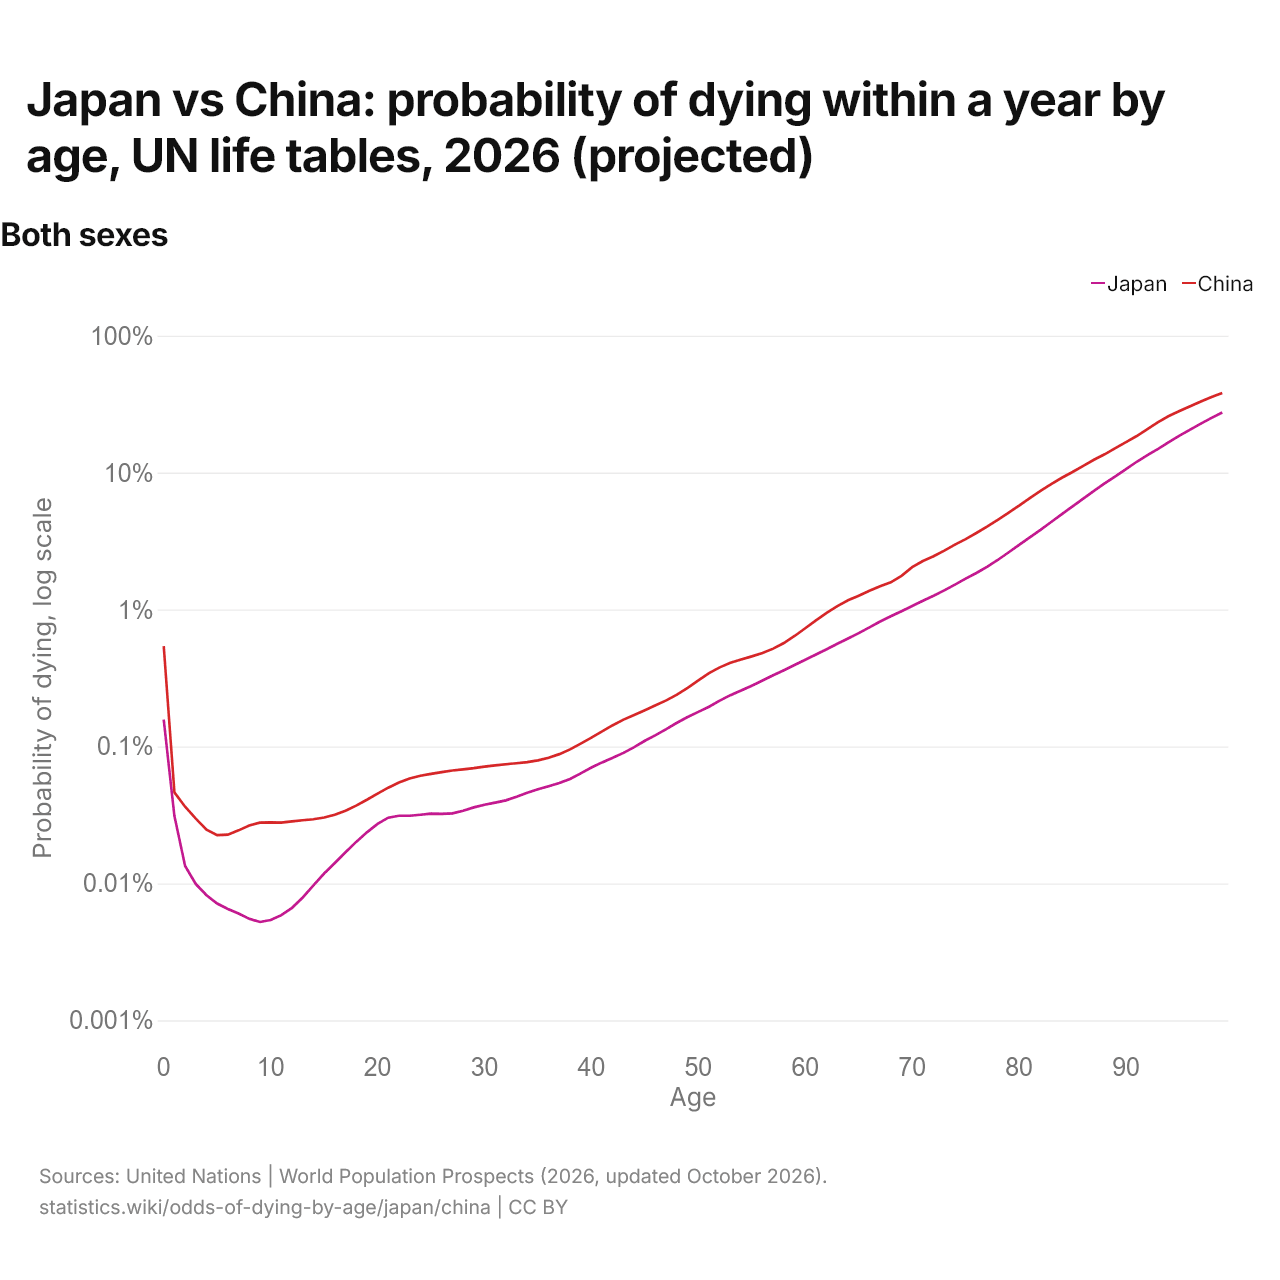
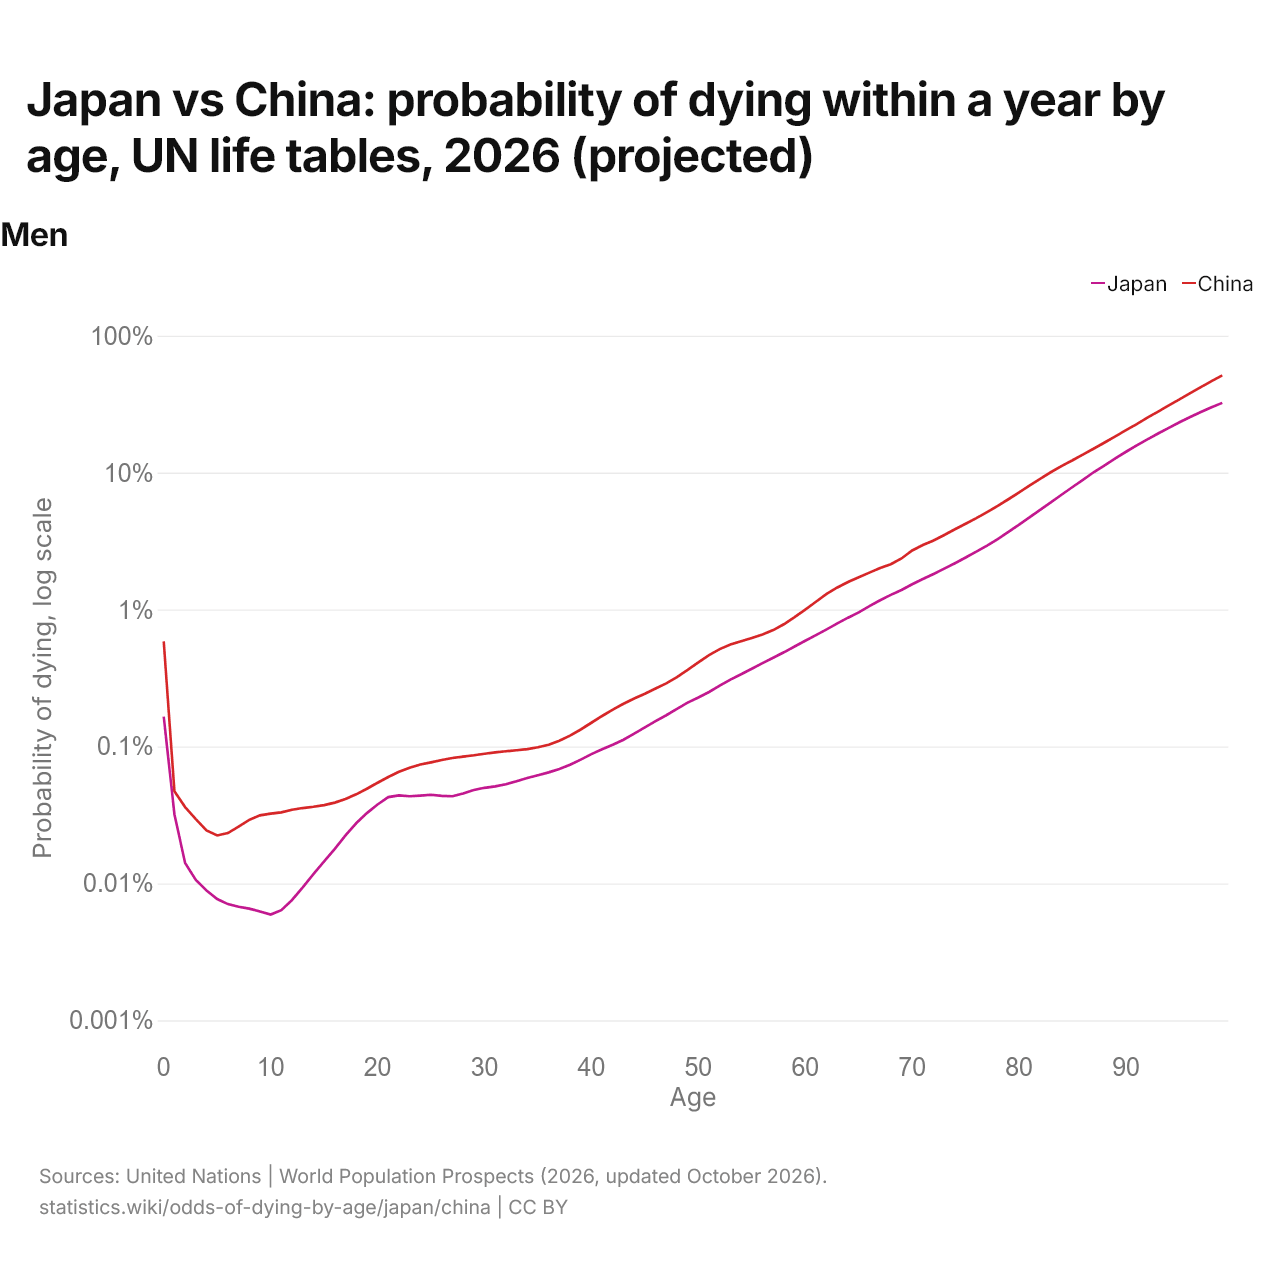
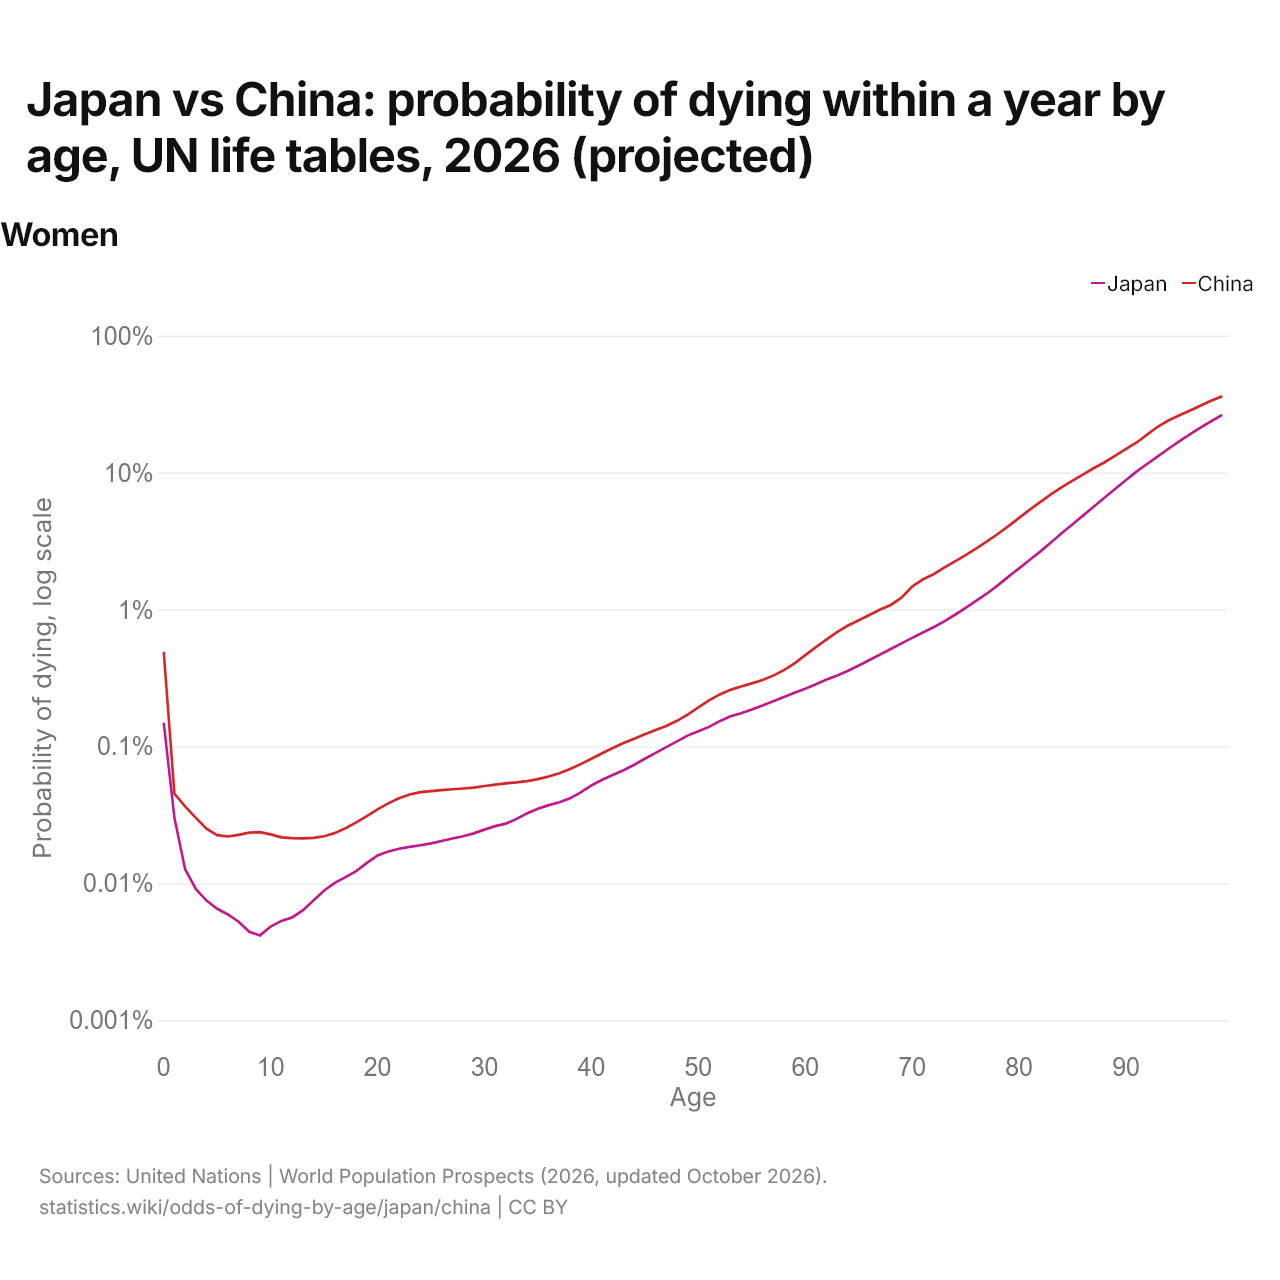
Japan vs China: probability of dying within a year by age, UN life tables, 2026 (projected)
| Age | Probability of dying, log scale | |
|---|---|---|
| Japan | China | |
| 0 | 0.157% | 0.54% |
| 1 | 0.031% | 0.046% |
| 2 | 0.013% | 0.036% |
| 3 | 0.01% | 0.03% |
| 4 | 0.008% | 0.025% |
| 5 | 0.007% | 0.022% |
| 6 | 0.007% | 0.023% |
| 7 | 0.006% | 0.024% |
| 8 | 0.006% | 0.026% |
| 9 | 0.005% | 0.028% |
| 10 | 0.005% | 0.028% |
| 11 | 0.006% | 0.028% |
| 12 | 0.007% | 0.028% |
| 13 | 0.008% | 0.029% |
| 14 | 0.01% | 0.029% |
| 15 | 0.012% | 0.03% |
| 16 | 0.014% | 0.032% |
| 17 | 0.017% | 0.034% |
| 18 | 0.02% | 0.037% |
| 19 | 0.024% | 0.041% |
| 20 | 0.027% | 0.045% |
| 21 | 0.03% | 0.05% |
| 22 | 0.031% | 0.054% |
| 23 | 0.031% | 0.058% |
| 24 | 0.032% | 0.061% |
| 25 | 0.032% | 0.063% |
| 26 | 0.032% | 0.065% |
| 27 | 0.033% | 0.067% |
| 28 | 0.034% | 0.068% |
| 29 | 0.036% | 0.069% |
| 30 | 0.037% | 0.071% |
| 31 | 0.039% | 0.073% |
| 32 | 0.04% | 0.074% |
| 33 | 0.043% | 0.075% |
| 34 | 0.046% | 0.077% |
| 35 | 0.049% | 0.079% |
| 36 | 0.051% | 0.083% |
| 37 | 0.054% | 0.088% |
| 38 | 0.058% | 0.095% |
| 39 | 0.064% | 0.105% |
| 40 | 0.07% | 0.116% |
| 41 | 0.076% | 0.129% |
| 42 | 0.083% | 0.143% |
| 43 | 0.09% | 0.157% |
| 44 | 0.099% | 0.17% |
| 45 | 0.11% | 0.184% |
| 46 | 0.121% | 0.2% |
| 47 | 0.134% | 0.217% |
| 48 | 0.149% | 0.239% |
| 49 | 0.164% | 0.268% |
| 50 | 0.179% | 0.304% |
| 51 | 0.195% | 0.343% |
| 52 | 0.216% | 0.378% |
| 53 | 0.237% | 0.408% |
| 54 | 0.256% | 0.432% |
| 55 | 0.278% | 0.455% |
| 56 | 0.303% | 0.482% |
| 57 | 0.331% | 0.518% |
| 58 | 0.36% | 0.569% |
| 59 | 0.393% | 0.641% |
| 60 | 0.43% | 0.73% |
| 61 | 0.469% | 0.834% |
| 62 | 0.513% | 0.947% |
| 63 | 0.562% | 1.06% |
| 64 | 0.615% | 1.17% |
| 65 | 0.673% | 1.26% |
| 66 | 0.741% | 1.37% |
| 67 | 0.817% | 1.48% |
| 68 | 0.892% | 1.58% |
| 69 | 0.972% | 1.76% |
| 70 | 1.06% | 2.04% |
| 71 | 1.16% | 2.26% |
| 72 | 1.26% | 2.45% |
| 73 | 1.38% | 2.69% |
| 74 | 1.52% | 2.98% |
| 75 | 1.68% | 3.27% |
| 76 | 1.85% | 3.62% |
| 77 | 2.05% | 4.03% |
| 78 | 2.3% | 4.52% |
| 79 | 2.61% | 5.09% |
| 80 | 2.97% | 5.75% |
| 81 | 3.37% | 6.51% |
| 82 | 3.82% | 7.35% |
| 83 | 4.36% | 8.24% |
| 84 | 4.98% | 9.17% |
| 85 | 5.67% | 10.1% |
| 86 | 6.46% | 11.2% |
| 87 | 7.36% | 12.4% |
| 88 | 8.33% | 13.6% |
| 89 | 9.4% | 15.1% |
| 90 | 10.6% | 16.7% |
| 91 | 12% | 18.5% |
| 92 | 13.4% | 20.8% |
| 93 | 14.9% | 23.4% |
| 94 | 16.7% | 25.9% |
| 95 | 18.6% | 28.2% |
| 96 | 20.6% | 30.5% |
| 97 | 22.8% | 33.1% |
| 98 | 25.1% | 35.7% |
| 99 | 27.5% | 38.1% |
| Age | Probability of dying, log scale | |
|---|---|---|
| Japan | China | |
| 0 | 0.165% | 0.585% |
| 1 | 0.032% | 0.047% |
| 2 | 0.014% | 0.036% |
| 3 | 0.011% | 0.029% |
| 4 | 0.009% | 0.024% |
| 5 | 0.008% | 0.022% |
| 6 | 0.007% | 0.023% |
| 7 | 0.007% | 0.026% |
| 8 | 0.007% | 0.029% |
| 9 | 0.006% | 0.031% |
| 10 | 0.006% | 0.032% |
| 11 | 0.006% | 0.033% |
| 12 | 0.008% | 0.035% |
| 13 | 0.009% | 0.035% |
| 14 | 0.012% | 0.036% |
| 15 | 0.015% | 0.037% |
| 16 | 0.018% | 0.039% |
| 17 | 0.022% | 0.041% |
| 18 | 0.028% | 0.045% |
| 19 | 0.033% | 0.049% |
| 20 | 0.038% | 0.054% |
| 21 | 0.043% | 0.06% |
| 22 | 0.044% | 0.065% |
| 23 | 0.043% | 0.07% |
| 24 | 0.044% | 0.074% |
| 25 | 0.044% | 0.077% |
| 26 | 0.044% | 0.08% |
| 27 | 0.043% | 0.082% |
| 28 | 0.045% | 0.084% |
| 29 | 0.048% | 0.086% |
| 30 | 0.05% | 0.088% |
| 31 | 0.051% | 0.09% |
| 32 | 0.053% | 0.092% |
| 33 | 0.056% | 0.094% |
| 34 | 0.059% | 0.096% |
| 35 | 0.062% | 0.099% |
| 36 | 0.065% | 0.103% |
| 37 | 0.068% | 0.11% |
| 38 | 0.073% | 0.12% |
| 39 | 0.08% | 0.133% |
| 40 | 0.088% | 0.149% |
| 41 | 0.095% | 0.167% |
| 42 | 0.103% | 0.186% |
| 43 | 0.112% | 0.205% |
| 44 | 0.124% | 0.224% |
| 45 | 0.138% | 0.243% |
| 46 | 0.153% | 0.265% |
| 47 | 0.169% | 0.289% |
| 48 | 0.188% | 0.321% |
| 49 | 0.209% | 0.362% |
| 50 | 0.228% | 0.411% |
| 51 | 0.25% | 0.465% |
| 52 | 0.278% | 0.514% |
| 53 | 0.308% | 0.555% |
| 54 | 0.337% | 0.587% |
| 55 | 0.369% | 0.62% |
| 56 | 0.406% | 0.657% |
| 57 | 0.445% | 0.708% |
| 58 | 0.487% | 0.78% |
| 59 | 0.537% | 0.88% |
| 60 | 0.591% | 1% |
| 61 | 0.65% | 1.14% |
| 62 | 0.716% | 1.3% |
| 63 | 0.792% | 1.45% |
| 64 | 0.872% | 1.59% |
| 65 | 0.954% | 1.72% |
| 66 | 1.06% | 1.86% |
| 67 | 1.17% | 2.01% |
| 68 | 1.28% | 2.14% |
| 69 | 1.39% | 2.36% |
| 70 | 1.53% | 2.7% |
| 71 | 1.67% | 2.96% |
| 72 | 1.82% | 3.19% |
| 73 | 1.99% | 3.5% |
| 74 | 2.18% | 3.86% |
| 75 | 2.4% | 4.23% |
| 76 | 2.65% | 4.65% |
| 77 | 2.93% | 5.14% |
| 78 | 3.27% | 5.71% |
| 79 | 3.69% | 6.39% |
| 80 | 4.17% | 7.17% |
| 81 | 4.73% | 8.06% |
| 82 | 5.37% | 9.03% |
| 83 | 6.09% | 10.1% |
| 84 | 6.92% | 11.2% |
| 85 | 7.85% | 12.3% |
| 86 | 8.9% | 13.6% |
| 87 | 10.1% | 15% |
| 88 | 11.3% | 16.6% |
| 89 | 12.7% | 18.4% |
| 90 | 14.2% | 20.4% |
| 91 | 15.8% | 22.6% |
| 92 | 17.5% | 25.2% |
| 93 | 19.3% | 27.9% |
| 94 | 21.2% | 31% |
| 95 | 23.3% | 34.3% |
| 96 | 25.5% | 38.1% |
| 97 | 27.7% | 42.1% |
| 98 | 30% | 46.6% |
| 99 | 32.3% | 51.3% |
| Age | Probability of dying, log scale | |
|---|---|---|
| Japan | China | |
| 0 | 0.149% | 0.49% |
| 1 | 0.03% | 0.045% |
| 2 | 0.013% | 0.036% |
| 3 | 0.009% | 0.03% |
| 4 | 0.007% | 0.025% |
| 5 | 0.007% | 0.022% |
| 6 | 0.006% | 0.022% |
| 7 | 0.005% | 0.023% |
| 8 | 0.004% | 0.024% |
| 9 | 0.004% | 0.024% |
| 10 | 0.005% | 0.023% |
| 11 | 0.005% | 0.022% |
| 12 | 0.006% | 0.021% |
| 13 | 0.006% | 0.021% |
| 14 | 0.007% | 0.021% |
| 15 | 0.009% | 0.022% |
| 16 | 0.01% | 0.023% |
| 17 | 0.011% | 0.025% |
| 18 | 0.012% | 0.028% |
| 19 | 0.014% | 0.031% |
| 20 | 0.016% | 0.035% |
| 21 | 0.017% | 0.038% |
| 22 | 0.018% | 0.042% |
| 23 | 0.018% | 0.045% |
| 24 | 0.019% | 0.046% |
| 25 | 0.02% | 0.047% |
| 26 | 0.02% | 0.048% |
| 27 | 0.021% | 0.049% |
| 28 | 0.022% | 0.049% |
| 29 | 0.023% | 0.05% |
| 30 | 0.025% | 0.051% |
| 31 | 0.026% | 0.053% |
| 32 | 0.027% | 0.054% |
| 33 | 0.03% | 0.055% |
| 34 | 0.033% | 0.056% |
| 35 | 0.035% | 0.058% |
| 36 | 0.037% | 0.06% |
| 37 | 0.039% | 0.064% |
| 38 | 0.042% | 0.069% |
| 39 | 0.046% | 0.074% |
| 40 | 0.052% | 0.081% |
| 41 | 0.057% | 0.089% |
| 42 | 0.062% | 0.098% |
| 43 | 0.067% | 0.106% |
| 44 | 0.074% | 0.114% |
| 45 | 0.081% | 0.123% |
| 46 | 0.09% | 0.132% |
| 47 | 0.099% | 0.141% |
| 48 | 0.109% | 0.154% |
| 49 | 0.12% | 0.171% |
| 50 | 0.129% | 0.193% |
| 51 | 0.139% | 0.217% |
| 52 | 0.153% | 0.24% |
| 53 | 0.166% | 0.259% |
| 54 | 0.175% | 0.274% |
| 55 | 0.186% | 0.289% |
| 56 | 0.199% | 0.306% |
| 57 | 0.214% | 0.329% |
| 58 | 0.23% | 0.361% |
| 59 | 0.247% | 0.405% |
| 60 | 0.264% | 0.464% |
| 61 | 0.285% | 0.532% |
| 62 | 0.308% | 0.606% |
| 63 | 0.33% | 0.686% |
| 64 | 0.357% | 0.764% |
| 65 | 0.39% | 0.834% |
| 66 | 0.428% | 0.912% |
| 67 | 0.469% | 1% |
| 68 | 0.515% | 1.08% |
| 69 | 0.566% | 1.22% |
| 70 | 0.621% | 1.47% |
| 71 | 0.68% | 1.66% |
| 72 | 0.743% | 1.81% |
| 73 | 0.819% | 2.02% |
| 74 | 0.916% | 2.25% |
| 75 | 1.03% | 2.5% |
| 76 | 1.16% | 2.8% |
| 77 | 1.31% | 3.15% |
| 78 | 1.5% | 3.56% |
| 79 | 1.74% | 4.07% |
| 80 | 2% | 4.67% |
| 81 | 2.31% | 5.36% |
| 82 | 2.66% | 6.12% |
| 83 | 3.1% | 6.95% |
| 84 | 3.62% | 7.82% |
| 85 | 4.2% | 8.73% |
| 86 | 4.87% | 9.72% |
| 87 | 5.66% | 10.8% |
| 88 | 6.57% | 11.9% |
| 89 | 7.62% | 13.3% |
| 90 | 8.82% | 14.9% |
| 91 | 10.2% | 16.6% |
| 92 | 11.6% | 19% |
| 93 | 13.2% | 21.7% |
| 94 | 15% | 24.1% |
| 95 | 17% | 26.2% |
| 96 | 19.1% | 28.4% |
| 97 | 21.4% | 30.9% |
| 98 | 23.8% | 33.6% |
| 99 | 26.4% | 36.1% |
In 2026, the risk of dying within a year is 0.16% at birth in Japan and 0.54% in China; at 80, it is 3.0% and 5.8%.
Compare the odds of dying by age in any 2 countries
Sources:
- United Nations | World Population Prospects (2026, updated October 2026)
Creative Commons Attribution (CC BY): you may copy, share, adapt and reuse this content, also commercially, as long as you credit statistics.wiki and note any changes you made. The sources listed above may have their own license terms.