
Most common language by country
| Country | Most common language | Share of the population | Languages listed | Reported to the UN in |
|---|---|---|---|---|
 Albania |
Albanian | 91.1% | 5 | 2024 |
 Armenia |
Armenian | 97.2% | 6 | 2024 |
 Australia |
English | 66.1% | 438 | 2023 |
 Azerbaijan |
Azerbaijani | 96.1% | 14 | 2022 |
 Belarus |
Russian | 71.4% | 6 | 2021 |
 Belize |
Spanish | 46.0% | 12 | 2005 |
 Bolivia |
Spanish | 61.4% | 8 | 2014 |
 Botswana |
Setswana | 71.9% | 16 | 2024 |
 Brunei |
English and Malay | 56.9% | 8 | 2023 |
 Bulgaria |
Bulgarian | 77.3% | 6 | 2023 |
 Burkina Faso |
Mooré | 45.4% | 31 | 2009 |
 Cambodia |
Khmer | 95.7% | 34 | 2024 |
 Canada |
English | 67.7% | 54 | 2013 |
 Cayman Islands |
English | 88.7% | 11 | 2024 |
 Croatia |
Croatian | 95.2% | 26 | 2024 |
 Cyprus |
Greek | 79.5% | 17 | 2024 |
 Czech Republic |
Czech | 87.3% | 10 | 2022 |
 East Timor |
Tetum Prasa | 30.1% | 38 | 2019 |
 Ecuador |
Castellano | 93.5% | 18 | 2025 |
 Estonia |
Estonian | 67.2% | 22 | 2022 |
 Ethiopia |
Oromigna | 33.8% | 68 | 2010 |
 Finland |
Finnish | 87.1% | 81 | 2022 |
 Georgia |
Georgian | 87.6% | 8 | 2016 |
 Ghana |
Asante | 16.0% | 65 | 2013 |
 Guinea-Bissau |
Creole | 70.7% | 7 | 2015 |
 Hungary |
Hungarian | 83.7% | 10 | 2013 |
 India |
Hindi | 42.5% | 22 | 2007 |
 Indonesia |
Javanese | 31.9% | 10 | 2015 |
 Kyrgyzstan |
Kyrgyz | 67.0% | 15 | 2007 |
 Latvia |
Latvian | 56.3% | 8 | 2013 |
 Liechtenstein |
German | 93.1% | 10 | 2023 |
 Lithuania |
Lithuanian | 85.3% | 7 | 2022 |
 Luxembourg |
Luxembourgish | 42.8% | 9 | 2025 |
 Malawi |
Chichewa | 32.6% | 13 | 2009 |
 Mali |
Bambara | 47.7% | 19 | 2014 |
 Malta |
Maltese | 70.9% | 7 | 2024 |
 Mauritius |
Creole | 78.6% | 55 | 2024 |
 Mexico |
Spanish | 84.1% | 73 | 2021 |
 Moldova |
Moldavian | 55.1% | 17 | 2016 |
 Montenegro |
Serbian | 45.1% | 13 | 2013 |
 Mozambique |
Emakhuwa | 28.5% | 10 | 2022 |
 Namibia |
Ovambo | 49.4% | 12 | 2014 |
 Nepal |
Nepali | 44.6% | 91 | 2013 |
 New Zealand |
English | 78.6% | 166 | 2016 |
 Nicaragua |
Spanish | 95.2% | 8 | 2009 |
 North Macedonia |
Macedonian | 61.4% | 9 | 2024 |
 Pakistan |
Punjabi | 37.0% | 15 | 2025 |
 Palau |
Palauan | 67.7% | 9 | 2008 |
 Peru |
Spanish | 82.9% | 9 | 2019 |
 Philippines |
Tagalog | 29.3% | 104 | 2005 |
 Poland |
Polish | 95.5% | 34 | 2023 |
 Romania |
Romanian | 79.5% | 20 | 2023 |
 Rwanda |
Kinyarwanda | 55.1% | 33 | 2024 |
 Serbia |
Serbian | 84.4% | 20 | 2024 |
 Seychelles |
Creole | 91.2% | 4 | 2005 |
 Singapore |
Chinese and English | 45.8% | 9 | 2021 |
 Slovakia |
Slovak | 81.8% | 15 | 2023 |
 Slovenia |
Slovenian | 87.7% | 14 | 2003 |
 South Africa |
Isizulu | 22.7% | 20 | 2024 |
 Switzerland |
German | 47.9% | 22 | 2022 |
 Tajikistan |
Tajik | 84.4% | 8 | 2024 |
 Thailand |
Thai | 90.7% | 11 | 2013 |
 Togo |
Ewe | 28.8% | 15 | 2025 |
 Tonga |
English and Tongan | 87.0% | 5 | 2009 |
 Ukraine |
Ukrainian | 67.5% | 10 | 2003 |
 United Kingdom |
English | 92.2% | 16 | 2013 |
The table lists the most common language of 66 countries, from the census data they reported to the UN. Australia's table lists the most languages, 438.
The figures are the populations by language that the countries' censuses counted and reported to the United Nations Statistics Division. Countries ask different questions, about the mother tongue, the language spoken at home or any language a person speaks, and use their own lists of languages, so the tables differ from one country to the next. The year is the year the UN received the table, which can be later than the census.
Share of the most common language by country
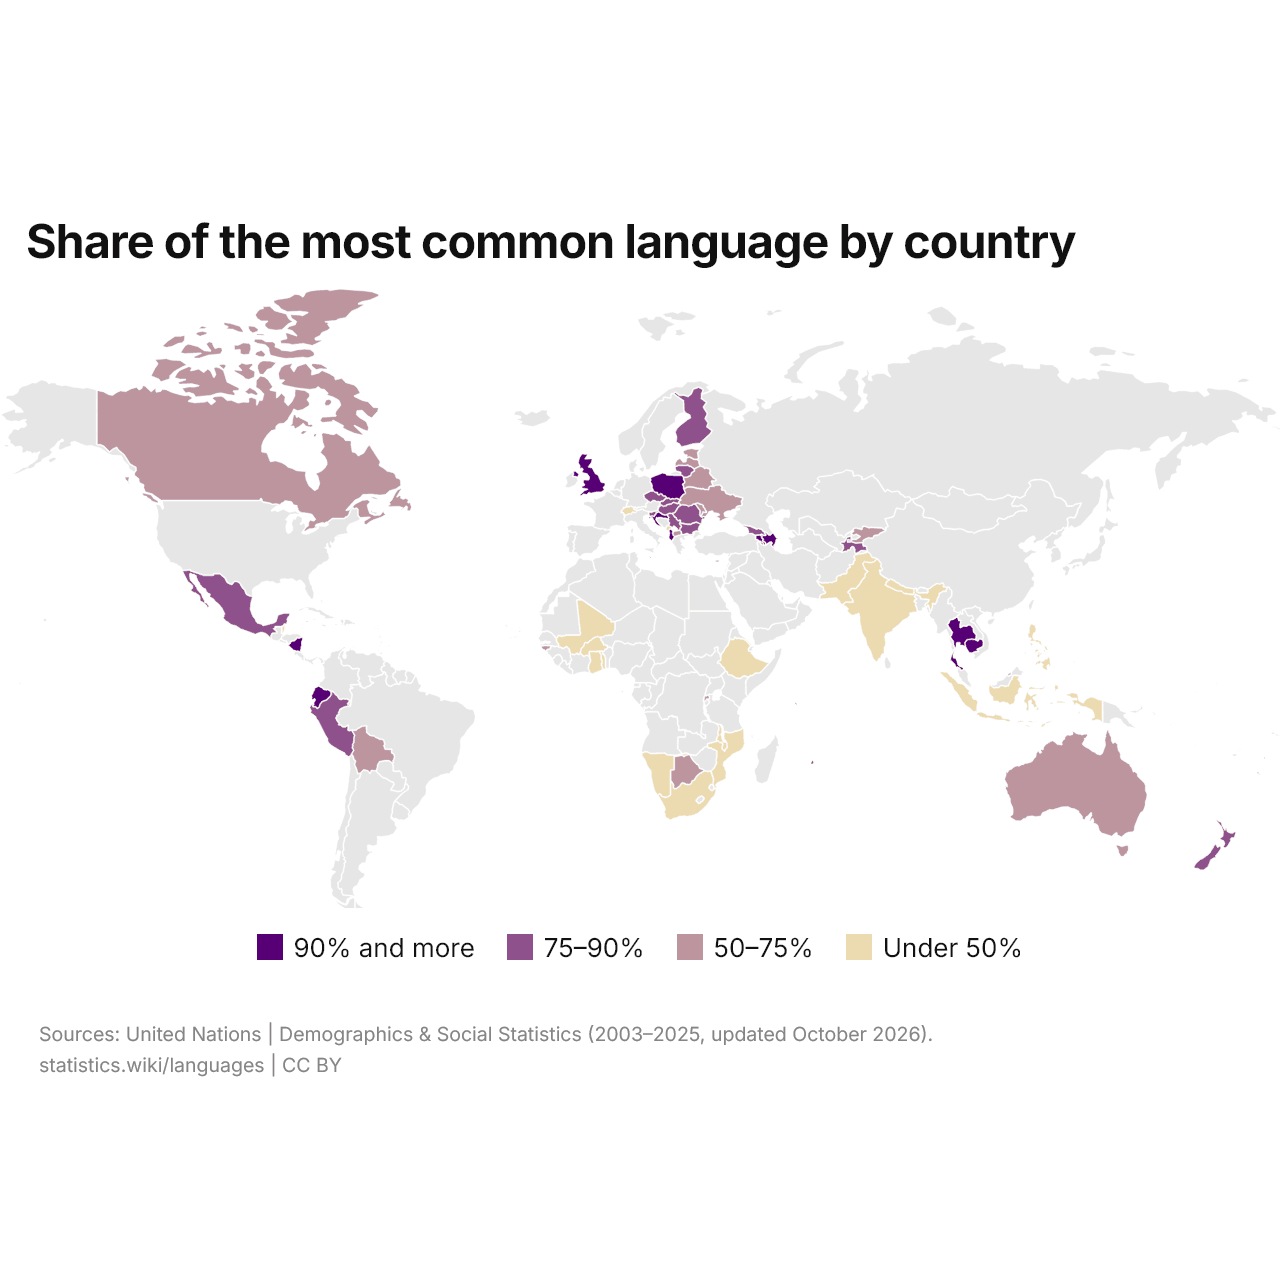
The most common language accounts for 90% or more of the population in 12 of the 66 countries and for less than half in 20.
Countries where the most common language has the largest share
-
Armenia
-
Azerbaijan
-
Cambodia
-
Poland
-
Nicaragua
-
Croatia
-
Ecuador
-
Liechtenstein
-
United Kingdom
-
Seychelles
Countries where the most common language has the smallest share
The most common language's share is highest in Armenia (Armenian, 97.2%) and lowest in Ghana (Asante, 16.0%).
Compare the languages of any 2 countries
Sources:
- United Nations | Demographics & Social Statistics (2003–2025, updated October 2026)
Creative Commons Attribution (CC BY): you may copy, share, adapt and reuse this content, also commercially, as long as you credit statistics.wiki and note any changes you made. The sources listed above may have their own license terms.