
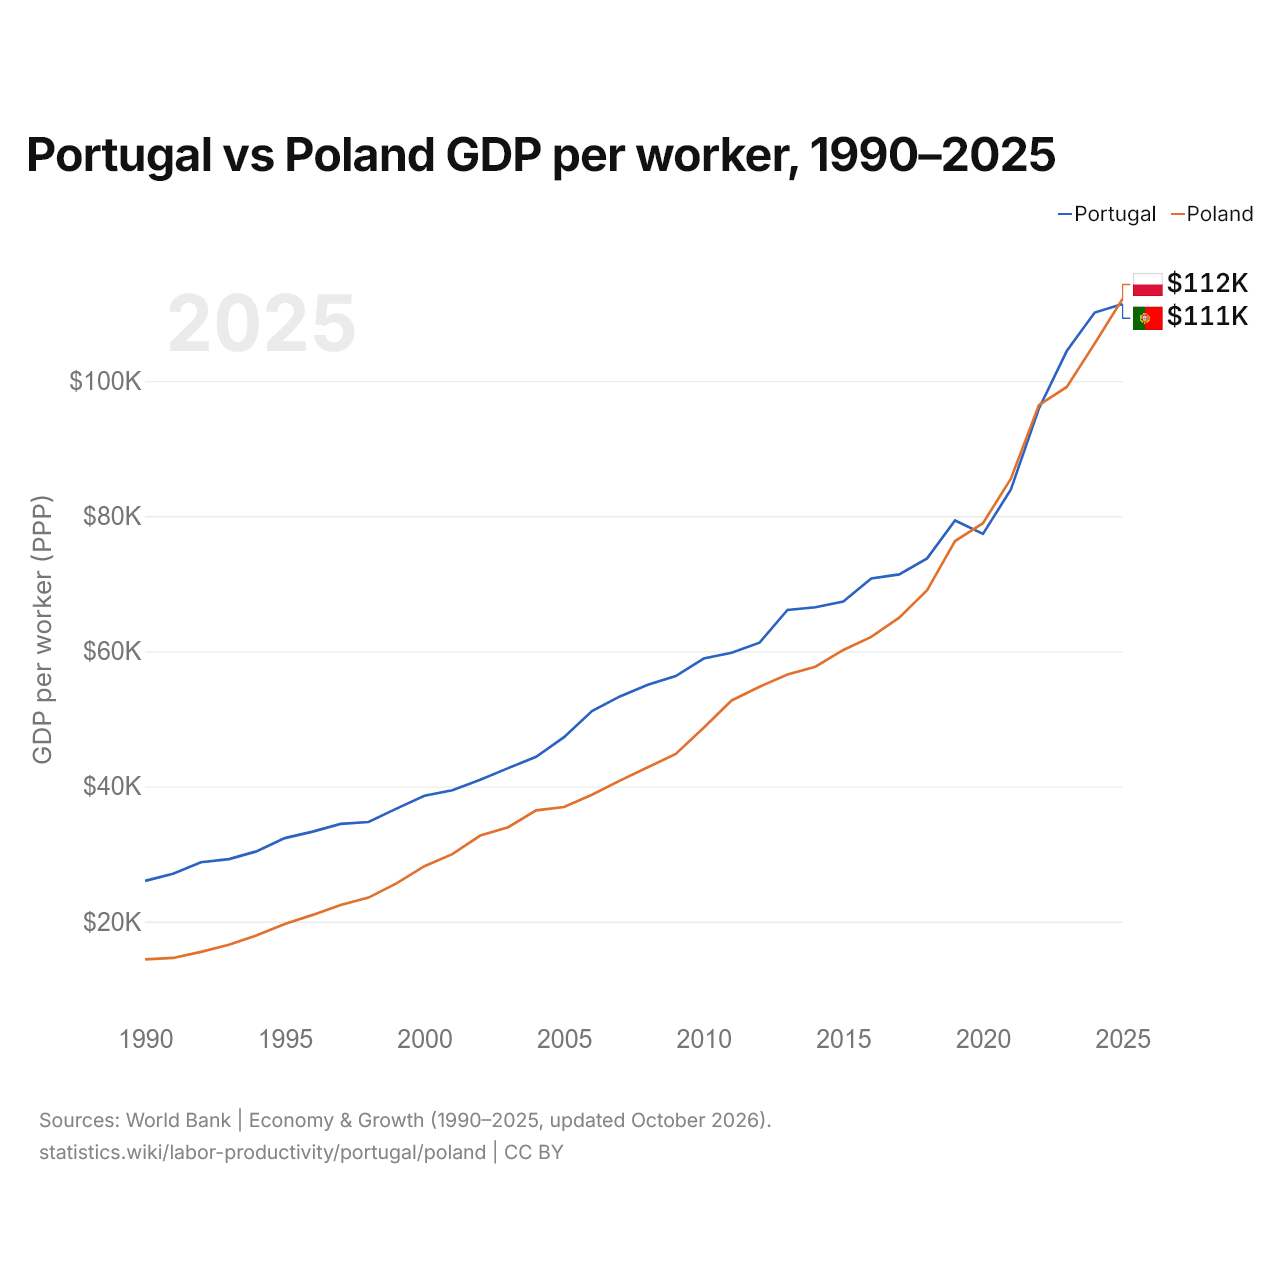
Portugal vs Poland GDP per worker, 1990–2025
1x
| Year | GDP per worker (PPP) | |
|---|---|---|
 Portugal |
 Poland |
|
| 2025 | $111,376 | $112,172 |
| 2024 | $110,121 | $105,546 |
| 2023 | $104,423 | $99,109 |
| 2022 | $95,897 | $96,428 |
| 2021 | $83,952 | $85,540 |
| 2020 | $77,368 | $78,953 |
| 2019 | $79,349 | $76,314 |
| 2018 | $73,742 | $69,028 |
| 2017 | $71,375 | $64,976 |
| 2016 | $70,768 | $62,128 |
| 2015 | $67,356 | $60,193 |
| 2014 | $66,506 | $57,715 |
| 2013 | $66,110 | $56,557 |
| 2012 | $61,272 | $54,753 |
| 2011 | $59,774 | $52,723 |
| 2010 | $58,926 | $48,672 |
| 2009 | $56,331 | $44,812 |
| 2008 | $55,055 | $42,824 |
| 2007 | $53,320 | $40,863 |
| 2006 | $51,148 | $38,762 |
| 2005 | $47,292 | $36,951 |
| 2004 | $44,378 | $36,453 |
| 2003 | $42,706 | $33,960 |
| 2002 | $40,988 | $32,724 |
| 2001 | $39,441 | $29,982 |
| 2000 | $38,616 | $28,195 |
| 1999 | $36,712 | $25,648 |
| 1998 | $34,730 | $23,548 |
| 1997 | $34,457 | $22,457 |
| 1996 | $33,309 | $20,988 |
| 1995 | $32,353 | $19,656 |
| 1994 | $30,403 | $17,972 |
| 1993 | $29,249 | $16,580 |
| 1992 | $28,776 | $15,513 |
| 1991 | $27,087 | $14,618 |
| 1990 | $26,018 | $14,417 |
In 2025, GDP per worker (PPP) was $111,376 in Portugal and $112,172 in Poland: 0.71% higher in Poland. In 1990, it was $26,018 in Portugal and $14,417 in Poland, 1.8 times as high in Portugal.
Portugal vs Poland: GDP per worker figures
Compare the labor productivity of any 2 countries
Sources:
- World Bank | Economy & Growth (1990–2025, updated October 2026)
Creative Commons Attribution (CC BY): you may copy, share, adapt and reuse this content, also commercially, as long as you credit statistics.wiki and note any changes you made. The sources listed above may have their own license terms.