
United Arab Emirates GDP per worker
| Year | GDP per worker (PPP) | World rank |
|---|---|---|
| United Arab Emirates | ||
| 2024 | $122,814 | #29 |
| 2023 | $121,616 | #25 |
| 2022 | $119,783 | #23 |
| 2021 | $110,017 | #22 |
| 2020 | $106,190 | #20 |
| 2019 | $123,378 | #11 |
| 2018 | $120,227 | #11 |
| 2017 | $109,915 | #13 |
| 2016 | $109,030 | #11 |
| 2015 | - | - |
| 2014 | - | - |
| 2013 | - | - |
| 2012 | - | - |
| 2011 | - | - |
| 2010 | - | - |
| 2009 | - | - |
| 2008 | $153,869 | #6 |
| 2007 | - | - |
| 2006 | - | - |
| 2005 | $165,192 | #5 |
| 2004 | - | - |
| 2003 | - | - |
| 2002 | - | - |
| 2001 | - | - |
| 2000 | $161,133 | #4 |
| 1999 | - | - |
| 1998 | - | - |
| 1997 | - | - |
| 1996 | - | - |
| 1995 | $169,176 | #3 |
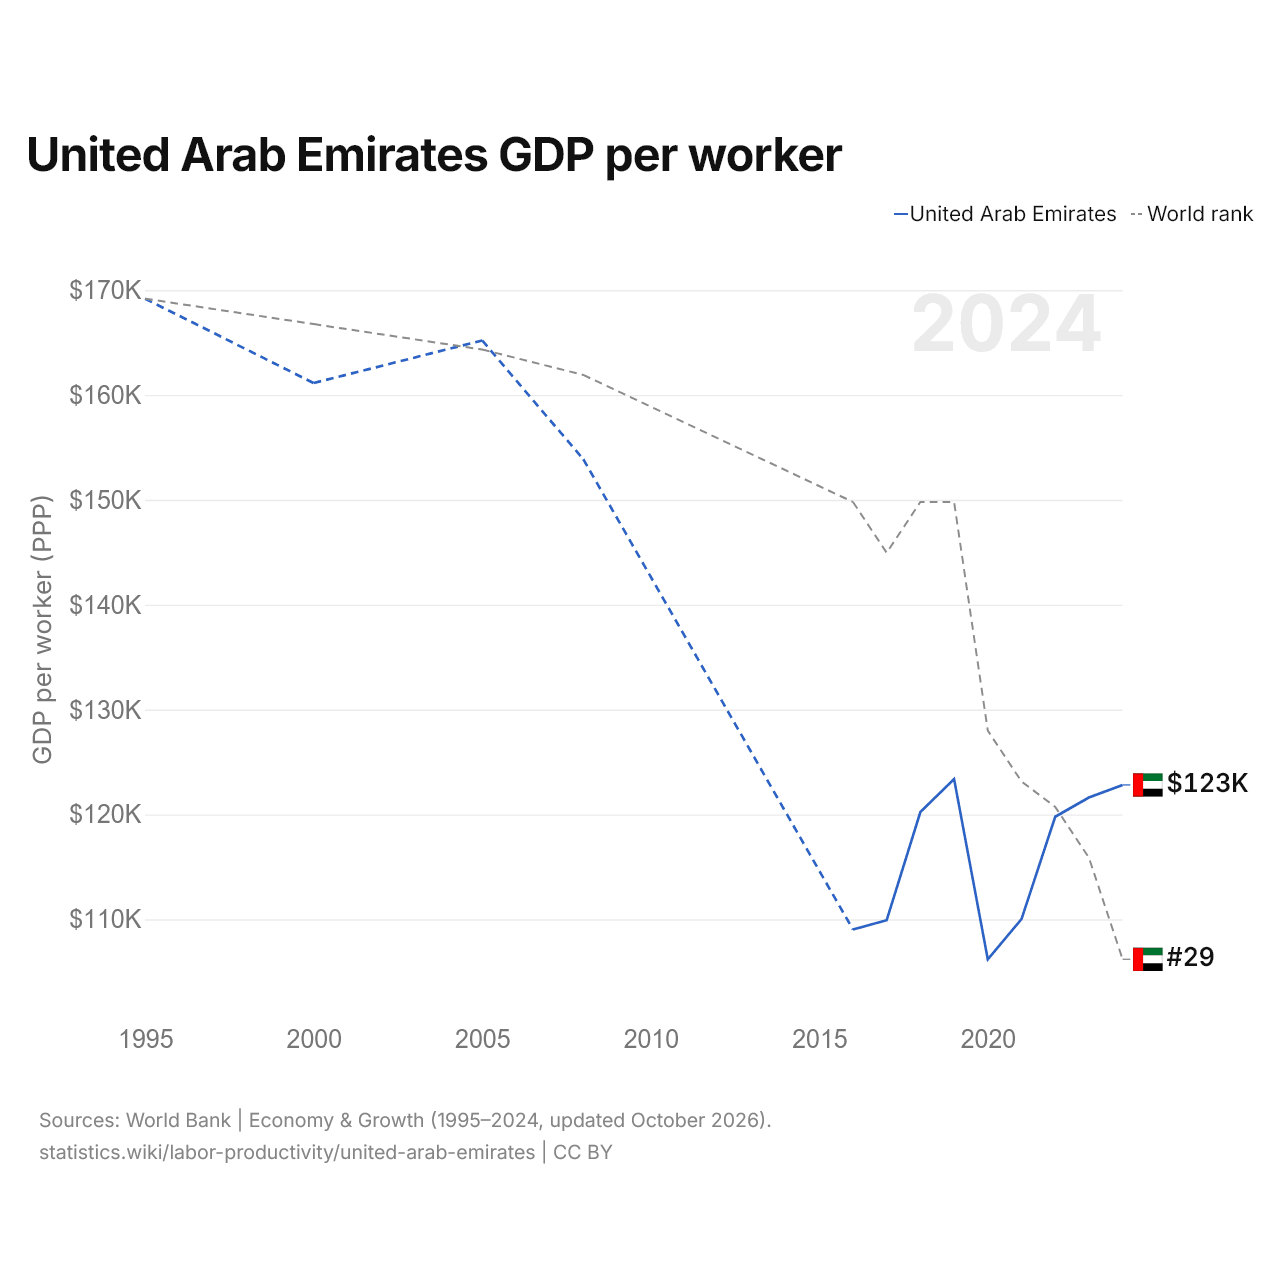
GDP per worker (PPP) in the United Arab Emirates is $122,814, down from $169,176 in 1995. It was lowest in 2020, at $106,190. It is the 29th highest in the world, down from 25th the year before. Its highest rank was 3rd, last held in 1995.
In constant 2015 dollars, the United Arab Emirates' GDP per worker is 43% smaller than in 1995, an average fall of 1.9% a year.
The United Arab Emirates' GDP per worker (PPP) is the 6th highest of 43 countries in Asia, where it ranges from Afghanistan's $9,962 (2021) to Singapore's $274,424.
United Arab Emirates in the world ranking by GDP per worker
| Rank | Country | GDP per worker (PPP) | Real growth per year, 2014–2024 | |
|---|---|---|---|---|
| 26 |
 Israel |
$129,066 (2025) | +1.3% (2015–2025) | vs Israel |
| 27 |
 Slovenia |
$125,200 (2025) | +1.9% (2015–2025) | |
| 28 |
 Romania |
$125,049 (2025) | +3.3% (2015–2025) | |
| 29 |
 UAE |
$122,814 | n/a | |
| 30 |
 Czech Republic |
$121,433 (2025) | +1.2% (2015–2025) | |
| 31 |
 Croatia |
$118,993 (2025) | +2.8% (2015–2025) | |
| 32 |
 Turkey |
$115,057 (2025) | +2.5% (2015–2025) | vs Turkey |
Compare United Arab Emirates labor productivity with other countries
Sources:
- World Bank | Economy & Growth (1995–2025, updated October 2026)
Creative Commons Attribution (CC BY): you may copy, share, adapt and reuse this content, also commercially, as long as you credit statistics.wiki and note any changes you made. The sources listed above may have their own license terms.