
Uganda health spending per person chart: US$ and PPP $
| Year | $ per person | World rank | |
|---|---|---|---|
| US$ | PPP $ | ||
| 2023 | $45 | $139 | #176 |
| 2022 | $44 | $139 | #175 |
| 2021 | $51 | $152 | #171 |
| 2020 | $45 | $134 | #173 |
| 2019 | $33 | $98 | #181 |
| 2018 | $33 | $98 | #181 |
| 2017 | $31 | $91 | #179 |
| 2016 | $39 | $112 | #172 |
| 2015 | $40 | $117 | #172 |
| 2014 | $51 | $124 | #166 |
| 2013 | $53 | $132 | #163 |
| 2012 | $55 | $138 | #160 |
| 2011 | $55 | $163 | #157 |
| 2010 | $52 | $141 | #154 |
| 2009 | $44 | $118 | #155 |
| 2008 | $40 | $102 | #157 |
| 2007 | $36 | $97 | #155 |
| 2006 | $32 | $94 | #157 |
| 2005 | $26 | $74 | #160 |
| 2004 | $19 | $52 | #170 |
| 2003 | $14 | $48 | #174 |
| 2002 | $16 | $52 | #163 |
| 2001 | $16 | $49 | #157 |
| 2000 | $16 | $48 | #154 |
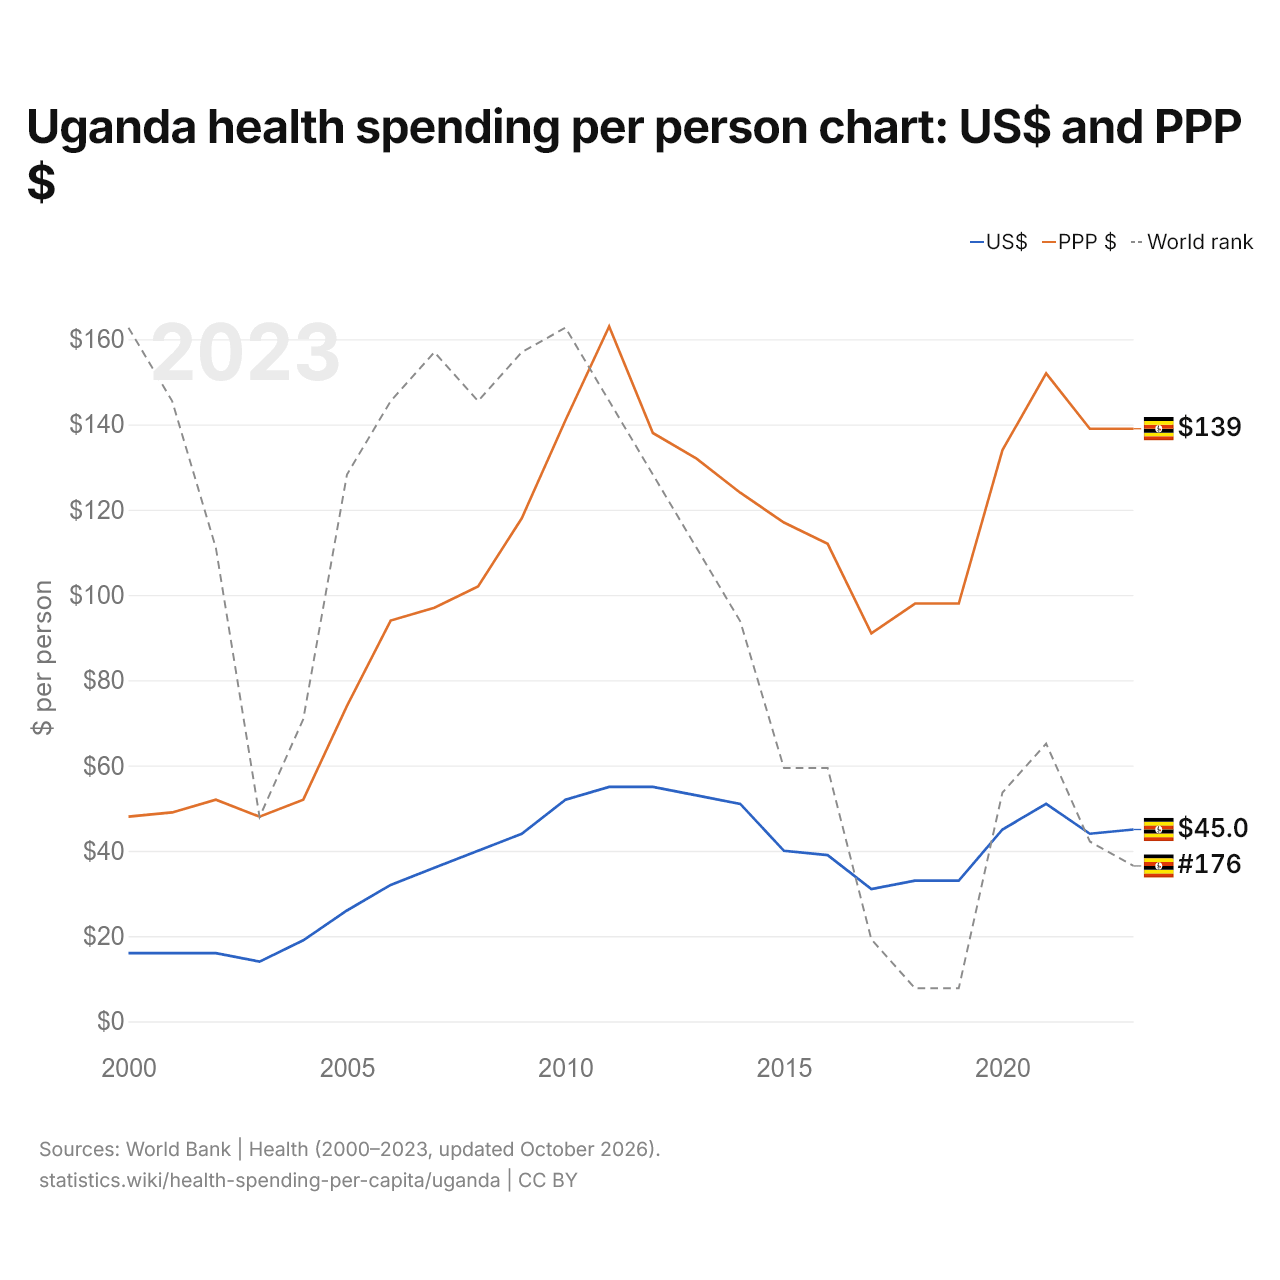
Health spending in Uganda is $45 per person, up from $16 in 2000. It was highest in 2011, at $55. It is the 176th highest in the world in US$, down from 175th the year before. Its highest rank was 154th, last held in 2010. In PPP dollars, Uganda's health spending per person is $139.
Health spending per person in Uganda is the 41st highest of the 54 countries of Africa, where it ranges from Madagascar's $17 to the Seychelles' $766. In total, health spending in Uganda comes to an estimated $2.2 billion a year, 4.5% of GDP.
Who pays for health care in Uganda: shares of current health spending
| Year | Share of current health spending | |||
|---|---|---|---|---|
| Government | Out-of-pocket | Other private | External aid | |
| 2023 | 21.8% | 32.2% | 2% | 44.1% |
| 2022 | 22.1% | 33.8% | 2.1% | 42% |
| 2021 | 21% | 27.4% | 1.7% | 50% |
| 2020 | 22.7% | 29.9% | 1.3% | 46% |
| 2019 | 15.1% | 38.3% | 4.6% | 42% |
| 2018 | 16.8% | 35.6% | 4.1% | 43.5% |
| 2017 | 16% | 38.1% | 2.8% | 43.1% |
| 2016 | 15.7% | 40.6% | 2.4% | 41.3% |
| 2015 | 15.2% | 39.5% | 2.5% | 42.9% |
| 2014 | 17.8% | 40.1% | 6.1% | 36% |
| 2013 | 16.8% | 42.5% | 3.2% | 37.4% |
| 2012 | 15.1% | 37.5% | 1.3% | 46% |
| 2011 | 13.6% | 33% | 3.2% | 50.2% |
| 2010 | 16.1% | 37.4% | 1.4% | 45.1% |
| 2009 | 14.3% | 42.8% | 1.4% | 41.5% |
| 2008 | 17.2% | 52.7% | 1.6% | 28.5% |
| 2007 | 16.9% | 54.5% | 1.6% | 27% |
| 2006 | 15.2% | 54.1% | 1.5% | 29.3% |
| 2005 | 17.8% | 48.6% | 1.6% | 32% |
| 2004 | 29.1% | 38.4% | 1.8% | 30.7% |
| 2003 | 34.3% | 45.4% | 1.7% | 18.6% |
| 2002 | 30.7% | 44% | 1.1% | 24.1% |
| 2001 | 26.7% | 43.4% | 0.6% | 29.3% |
| 2000 | 25% | 43% | 0.5% | 31.5% |
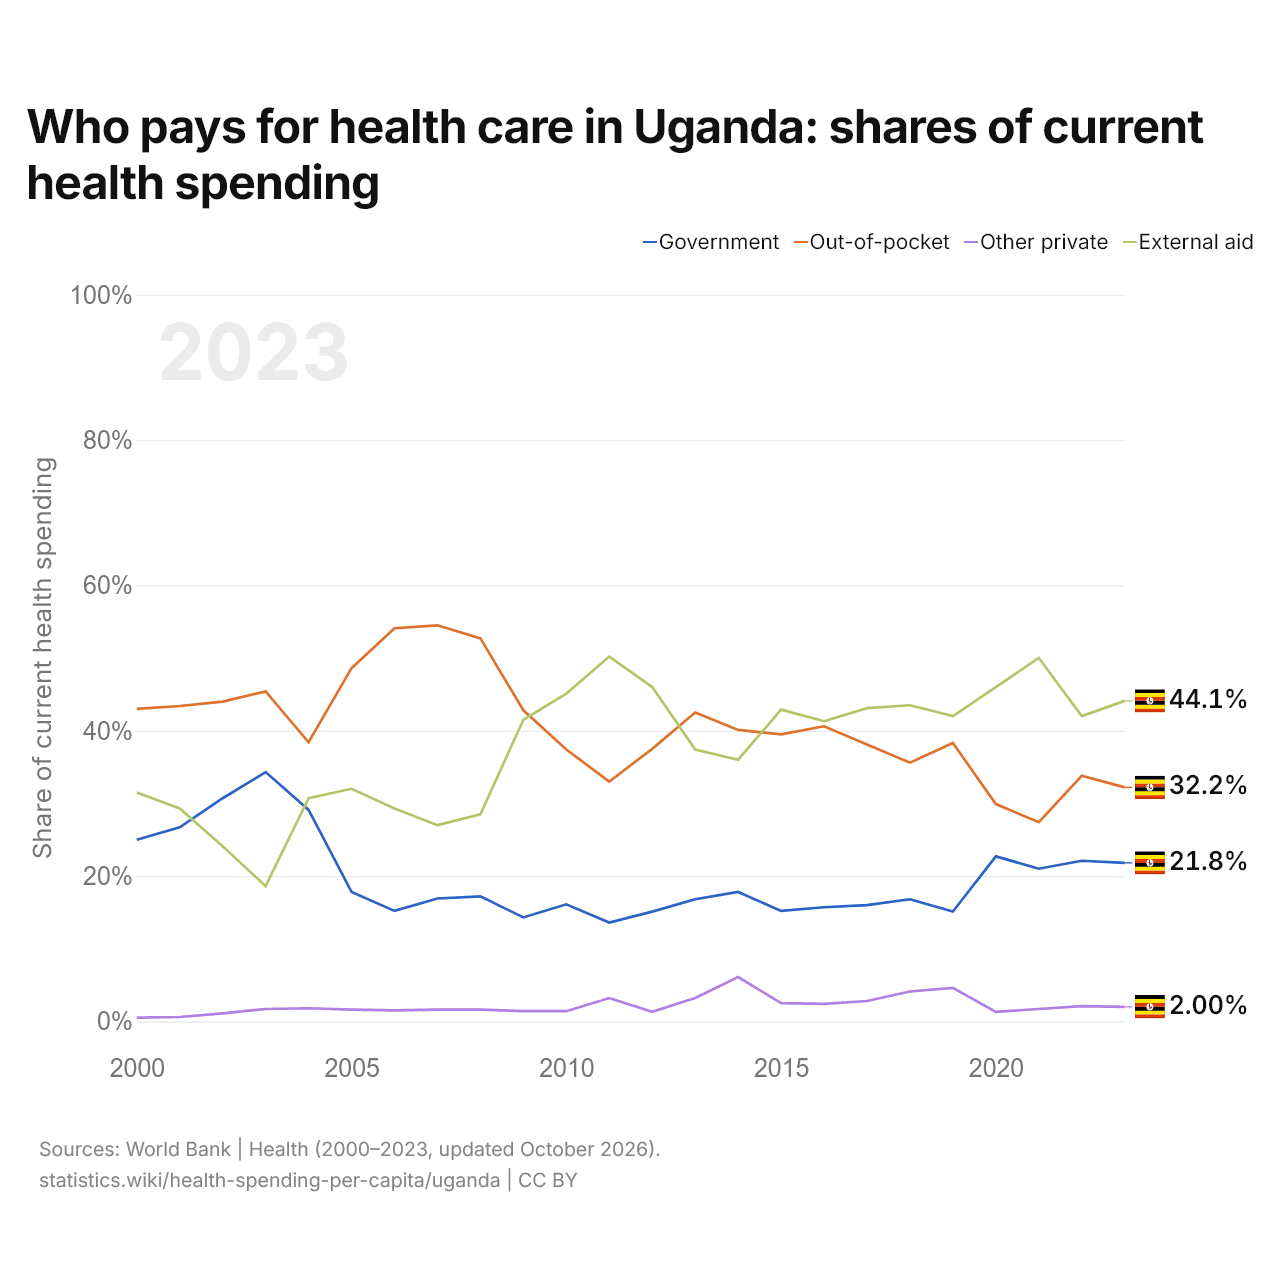
The government pays 21.8% of current health spending in Uganda, and households pay 32.2% directly out of pocket. Other private sources pay 2.0%, and external aid covers 44.1%. In 2000, the government's share was 25.0% and the out-of-pocket share 43.0%.
Uganda in the world ranking of health spending per person
| Rank | Country | US$ per person | PPP $ per person | |
|---|---|---|---|---|
| 173 |
 Yemen |
$48 | $169 | |
| 174 |
 Chad |
$47 | $130 | |
| 175 |
 Benin |
$47 | $138 | |
| 176 |
 Uganda |
$45 | $139 | |
| 177 |
 Malawi |
$41 | $125 | vs Malawi |
| 178 |
 Tanzania |
$36 | $119 | vs Tanzania |
| 179 |
 Sierra Leone |
$36 | $159 |
Compare Uganda health spending per capita with other countries
Sources:
- World Bank | Health (2000–2023, updated October 2026)
Creative Commons Attribution (CC BY): you may copy, share, adapt and reuse this content, also commercially, as long as you credit statistics.wiki and note any changes you made. The sources listed above may have their own license terms.