
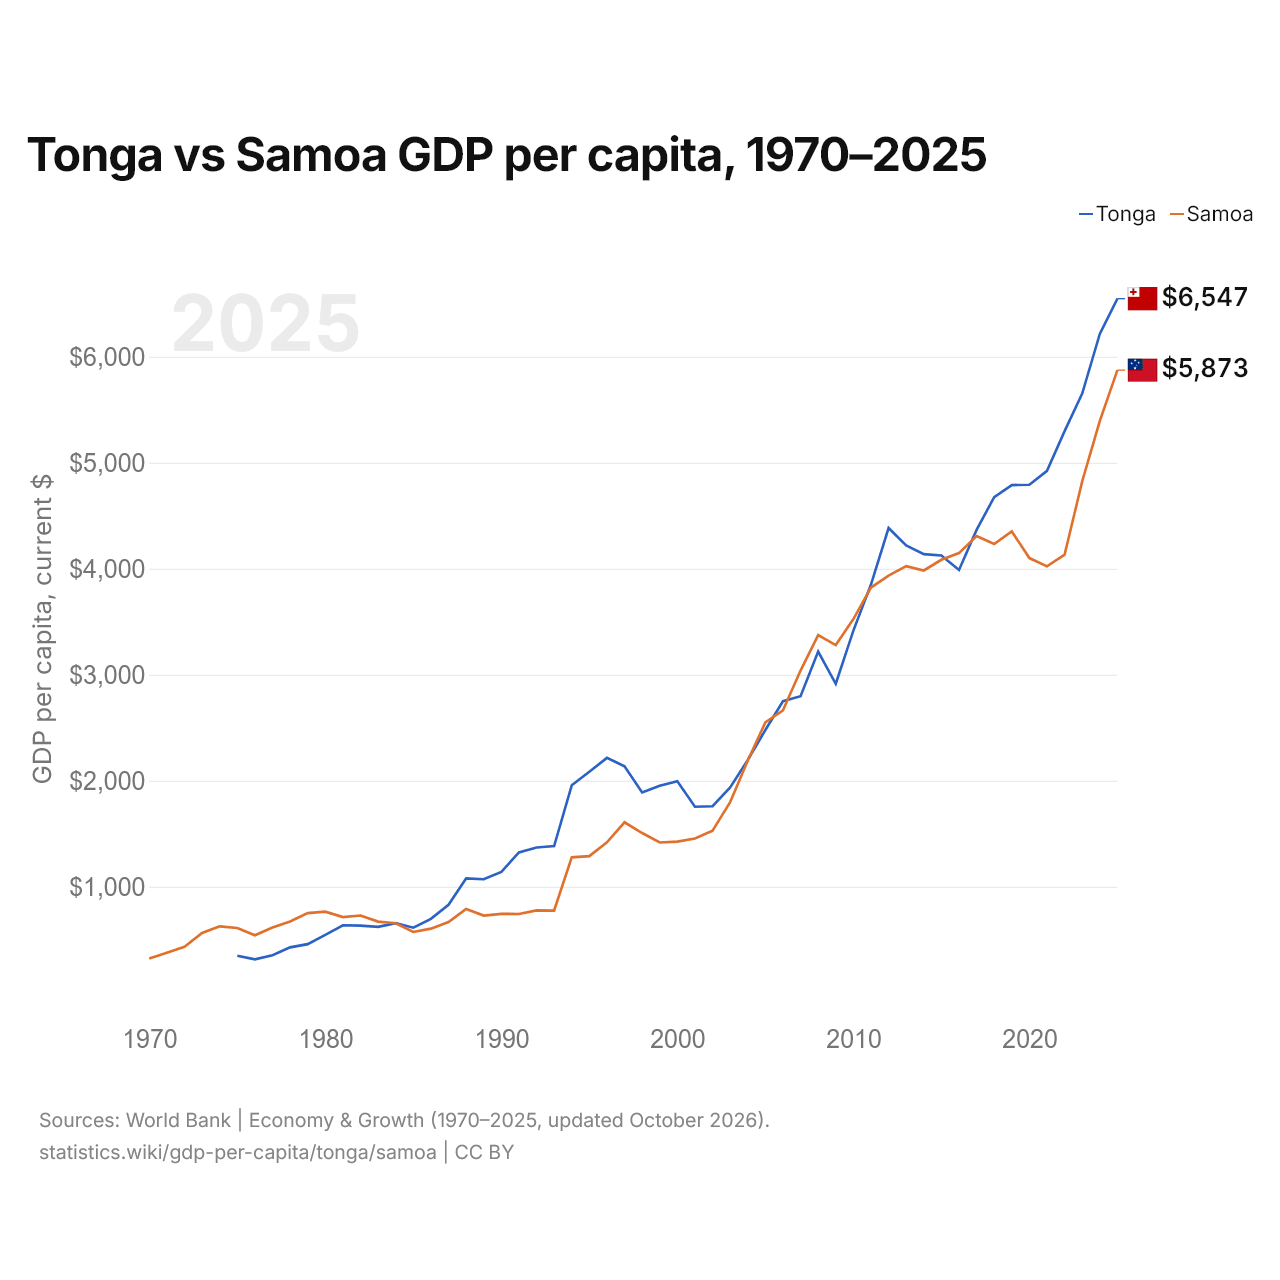
Tonga vs Samoa GDP per capita, 1970–2025
| Year | GDP per capita, current $ | |
|---|---|---|
 Tonga |
 Samoa |
|
| 2025 | $6,547 | $5,873 |
| 2024 | $6,215 | $5,393 |
| 2023 | $5,652 | $4,823 |
| 2022 | $5,298 | $4,132 |
| 2021 | $4,923 | $4,022 |
| 2020 | $4,792 | $4,100 |
| 2019 | $4,789 | $4,352 |
| 2018 | $4,675 | $4,232 |
| 2017 | $4,366 | $4,308 |
| 2016 | $3,988 | $4,147 |
| 2015 | $4,124 | $4,084 |
| 2014 | $4,137 | $3,983 |
| 2013 | $4,219 | $4,024 |
| 2012 | $4,384 | $3,935 |
| 2011 | $3,850 | $3,822 |
| 2010 | $3,416 | $3,524 |
| 2009 | $2,914 | $3,279 |
| 2008 | $3,218 | $3,374 |
| 2007 | $2,797 | $3,039 |
| 2006 | $2,750 | $2,663 |
| 2005 | $2,478 | $2,550 |
| 2004 | $2,195 | $2,189 |
| 2003 | $1,936 | $1,798 |
| 2002 | $1,759 | $1,528 |
| 2001 | $1,754 | $1,454 |
| 2000 | $1,995 | $1,425 |
| 1999 | $1,952 | $1,417 |
| 1998 | $1,889 | $1,506 |
| 1997 | $2,136 | $1,608 |
| 1996 | $2,215 | $1,419 |
| 1995 | $2,084 | $1,288 |
| 1994 | $1,957 | $1,277 |
| 1993 | $1,383 | $775 |
| 1992 | $1,370 | $777 |
| 1991 | $1,323 | $742 |
| 1990 | $1,139 | $744 |
| 1989 | $1,070 | $728 |
| 1988 | $1,078 | $790 |
| 1987 | $830 | $666 |
| 1986 | $696 | $604 |
| 1985 | $613 | $573 |
| 1984 | $656 | $655 |
| 1983 | $621 | $671 |
| 1982 | $633 | $728 |
| 1981 | $636 | $713 |
| 1980 | $545 | $765 |
| 1979 | $458 | $751 |
| 1978 | $428 | $671 |
| 1977 | $353 | $615 |
| 1976 | $315 | $541 |
| 1975 | $349 | $610 |
| 1974 | - | $626 |
| 1973 | - | $563 |
| 1972 | - | $433 |
| 1971 | - | $377 |
| 1970 | - | $322 |
In 2025, GDP per capita was $6,547 in Tonga and $5,873 in Samoa: 11% higher in Tonga. In 1975, it was $349 in Tonga and $610 in Samoa, 1.7 times as high in Samoa.
Tonga's GDP per capita has been higher than Samoa's every year since 2017. In constant 2015 dollars, Tonga's GDP per capita was 1.9 times as large in 2025 as in 1981, and Samoa's 2.1 times. At purchasing power parity the order is reversed: GDP per capita (PPP) is $9,319 in Samoa and $8,675 in Tonga.
Tonga vs Samoa: latest GDP per capita figures
Compare the GDP per capita of any 2 countries
Sources:
- World Bank | Economy & Growth (1970–2025, updated October 2026)
Creative Commons Attribution (CC BY): you may copy, share, adapt and reuse this content, also commercially, as long as you credit statistics.wiki and note any changes you made. The sources listed above may have their own license terms.