
Mexico vs El Salvador GDP by sector charts: services, industry and agriculture, % of GDP, 1965–2025
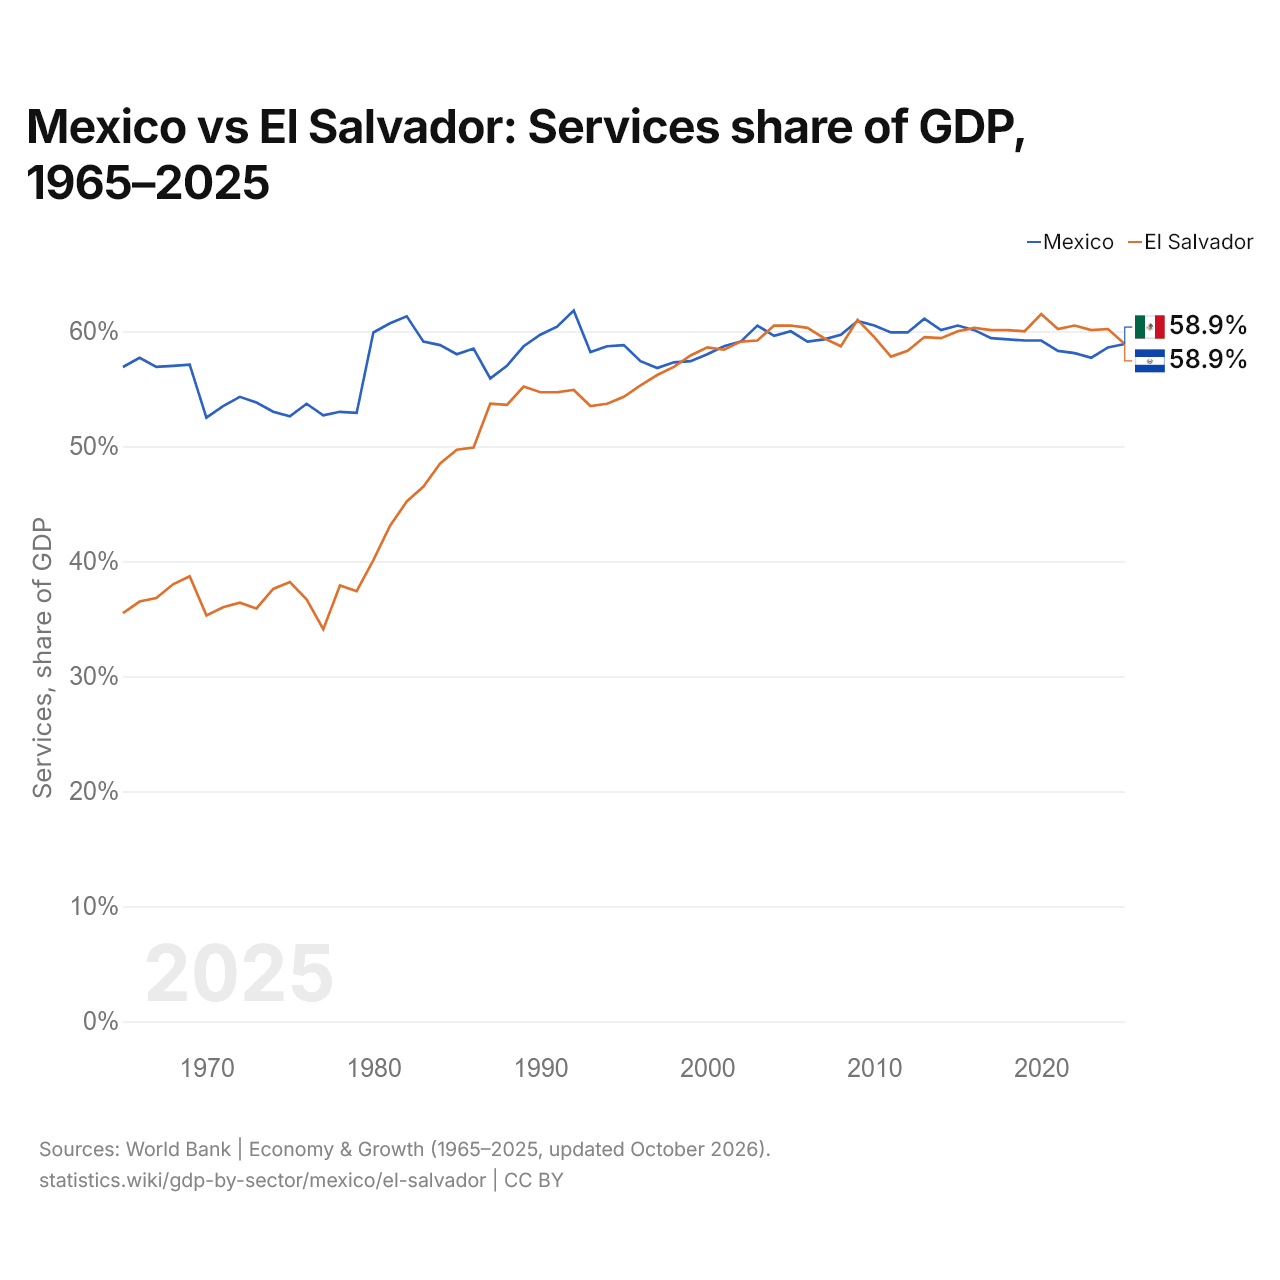
| Year | Services, share of GDP | |
|---|---|---|
 Mexico |
 El Salvador |
|
| 2025 | 58.9% | 58.9% |
| 2024 | 58.6% | 60.2% |
| 2023 | 57.7% | 60.1% |
| 2022 | 58.1% | 60.5% |
| 2021 | 58.3% | 60.2% |
| 2020 | 59.2% | 61.5% |
| 2019 | 59.2% | 60% |
| 2018 | 59.3% | 60.1% |
| 2017 | 59.4% | 60.1% |
| 2016 | 60.1% | 60.3% |
| 2015 | 60.5% | 60% |
| 2014 | 60.1% | 59.4% |
| 2013 | 61.1% | 59.5% |
| 2012 | 59.9% | 58.3% |
| 2011 | 59.9% | 57.8% |
| 2010 | 60.5% | 59.5% |
| 2009 | 60.9% | 61% |
| 2008 | 59.7% | 58.7% |
| 2007 | 59.3% | 59.4% |
| 2006 | 59.1% | 60.3% |
| 2005 | 60% | 60.5% |
| 2004 | 59.6% | 60.5% |
| 2003 | 60.5% | 59.2% |
| 2002 | 59.1% | 59.1% |
| 2001 | 58.7% | 58.4% |
| 2000 | 58% | 58.6% |
| 1999 | 57.4% | 57.9% |
| 1998 | 57.3% | 56.9% |
| 1997 | 56.8% | 56.2% |
| 1996 | 57.4% | 55.3% |
| 1995 | 58.8% | 54.3% |
| 1994 | 58.7% | 53.7% |
| 1993 | 58.2% | 53.5% |
| 1992 | 61.8% | 54.9% |
| 1991 | 60.4% | 54.7% |
| 1990 | 59.7% | 54.7% |
| 1989 | 58.7% | 55.2% |
| 1988 | 57% | 53.6% |
| 1987 | 55.9% | 53.7% |
| 1986 | 58.5% | 49.9% |
| 1985 | 58% | 49.7% |
| 1984 | 58.8% | 48.5% |
| 1983 | 59.1% | 46.5% |
| 1982 | 61.3% | 45.2% |
| 1981 | 60.7% | 43.1% |
| 1980 | 59.9% | 40.1% |
| 1979 | 52.9% | 37.4% |
| 1978 | 53% | 37.9% |
| 1977 | 52.7% | 34.1% |
| 1976 | 53.7% | 36.7% |
| 1975 | 52.6% | 38.2% |
| 1974 | 53% | 37.6% |
| 1973 | 53.8% | 35.9% |
| 1972 | 54.3% | 36.4% |
| 1971 | 53.5% | 36% |
| 1970 | 52.5% | 35.3% |
| 1969 | 57.1% | 38.7% |
| 1968 | 57% | 38% |
| 1967 | 56.9% | 36.8% |
| 1966 | 57.7% | 36.5% |
| 1965 | 56.9% | 35.5% |
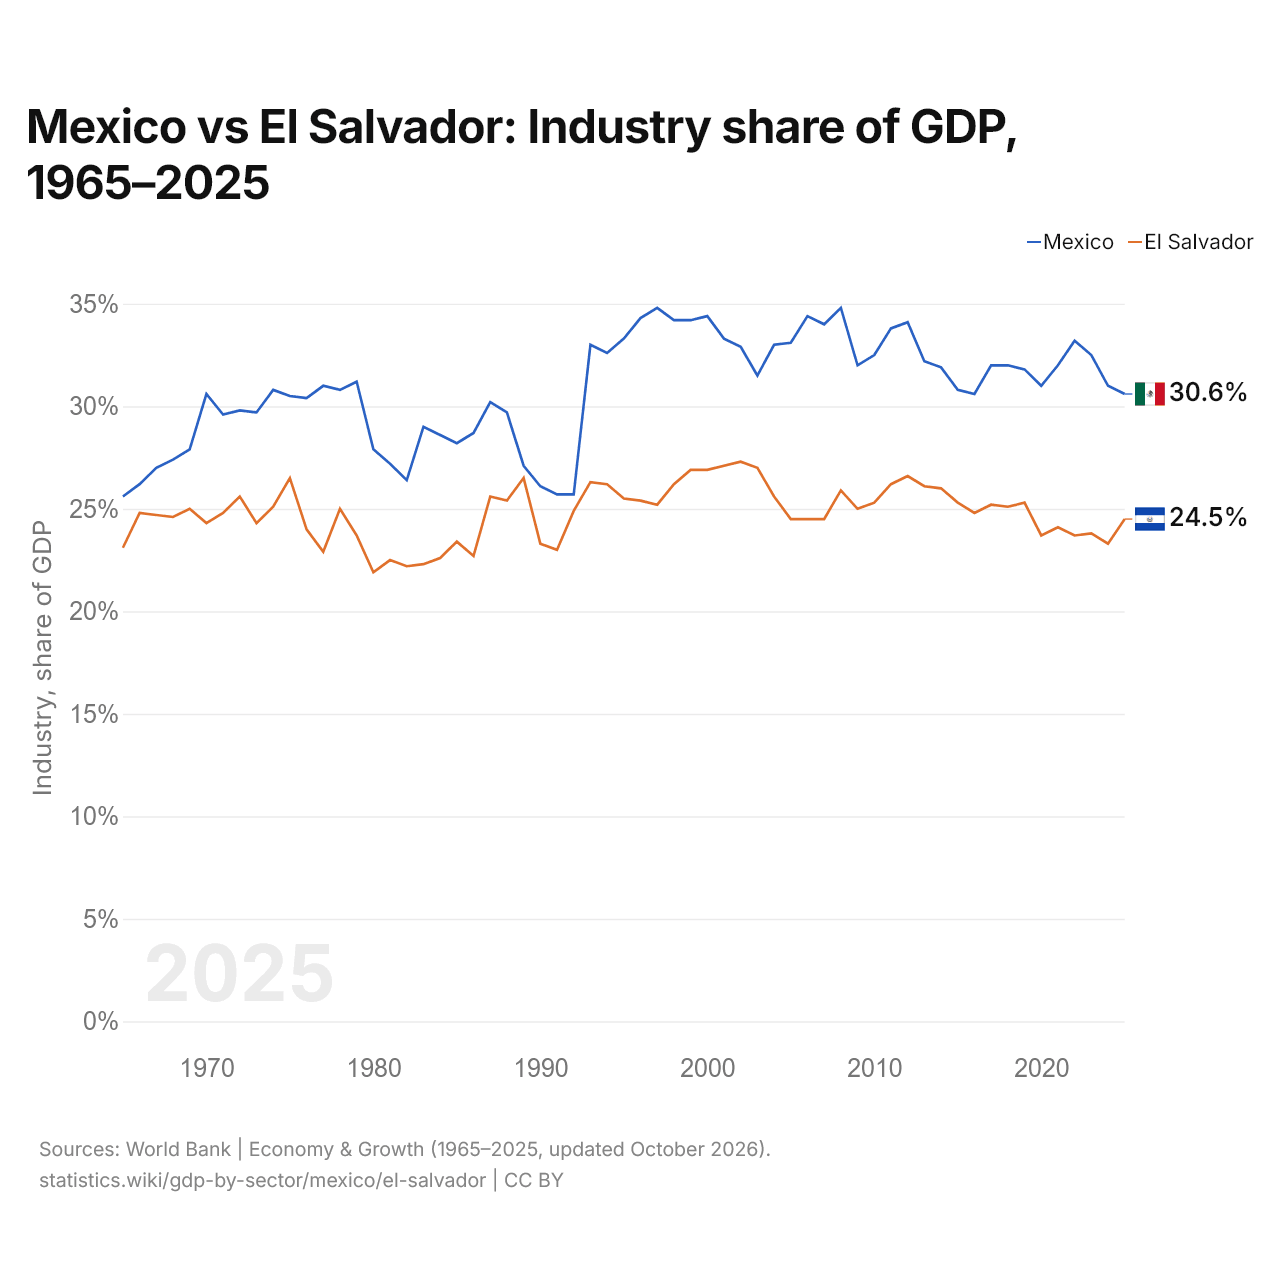
| Year | Industry, share of GDP | |
|---|---|---|
|
Mexico
|
El Salvador
|
|
| 2025 | 30.6% | 24.5% |
| 2024 | 31% | 23.3% |
| 2023 | 32.5% | 23.8% |
| 2022 | 33.2% | 23.7% |
| 2021 | 32% | 24.1% |
| 2020 | 31% | 23.7% |
| 2019 | 31.8% | 25.3% |
| 2018 | 32% | 25.1% |
| 2017 | 32% | 25.2% |
| 2016 | 30.6% | 24.8% |
| 2015 | 30.8% | 25.3% |
| 2014 | 31.9% | 26% |
| 2013 | 32.2% | 26.1% |
| 2012 | 34.1% | 26.6% |
| 2011 | 33.8% | 26.2% |
| 2010 | 32.5% | 25.3% |
| 2009 | 32% | 25% |
| 2008 | 34.8% | 25.9% |
| 2007 | 34% | 24.5% |
| 2006 | 34.4% | 24.5% |
| 2005 | 33.1% | 24.5% |
| 2004 | 33% | 25.6% |
| 2003 | 31.5% | 27% |
| 2002 | 32.9% | 27.3% |
| 2001 | 33.3% | 27.1% |
| 2000 | 34.4% | 26.9% |
| 1999 | 34.2% | 26.9% |
| 1998 | 34.2% | 26.2% |
| 1997 | 34.8% | 25.2% |
| 1996 | 34.3% | 25.4% |
| 1995 | 33.3% | 25.5% |
| 1994 | 32.6% | 26.2% |
| 1993 | 33% | 26.3% |
| 1992 | 25.7% | 24.9% |
| 1991 | 25.7% | 23% |
| 1990 | 26.1% | 23.3% |
| 1989 | 27.1% | 26.5% |
| 1988 | 29.7% | 25.4% |
| 1987 | 30.2% | 25.6% |
| 1986 | 28.7% | 22.7% |
| 1985 | 28.2% | 23.4% |
| 1984 | 28.6% | 22.6% |
| 1983 | 29% | 22.3% |
| 1982 | 26.4% | 22.2% |
| 1981 | 27.2% | 22.5% |
| 1980 | 27.9% | 21.9% |
| 1979 | 31.2% | 23.7% |
| 1978 | 30.8% | 25% |
| 1977 | 31% | 22.9% |
| 1976 | 30.4% | 24% |
| 1975 | 30.5% | 26.5% |
| 1974 | 30.8% | 25.1% |
| 1973 | 29.7% | 24.3% |
| 1972 | 29.8% | 25.6% |
| 1971 | 29.6% | 24.8% |
| 1970 | 30.6% | 24.3% |
| 1969 | 27.9% | 25% |
| 1968 | 27.4% | 24.6% |
| 1967 | 27% | 24.7% |
| 1966 | 26.2% | 24.8% |
| 1965 | 25.6% | 23.1% |
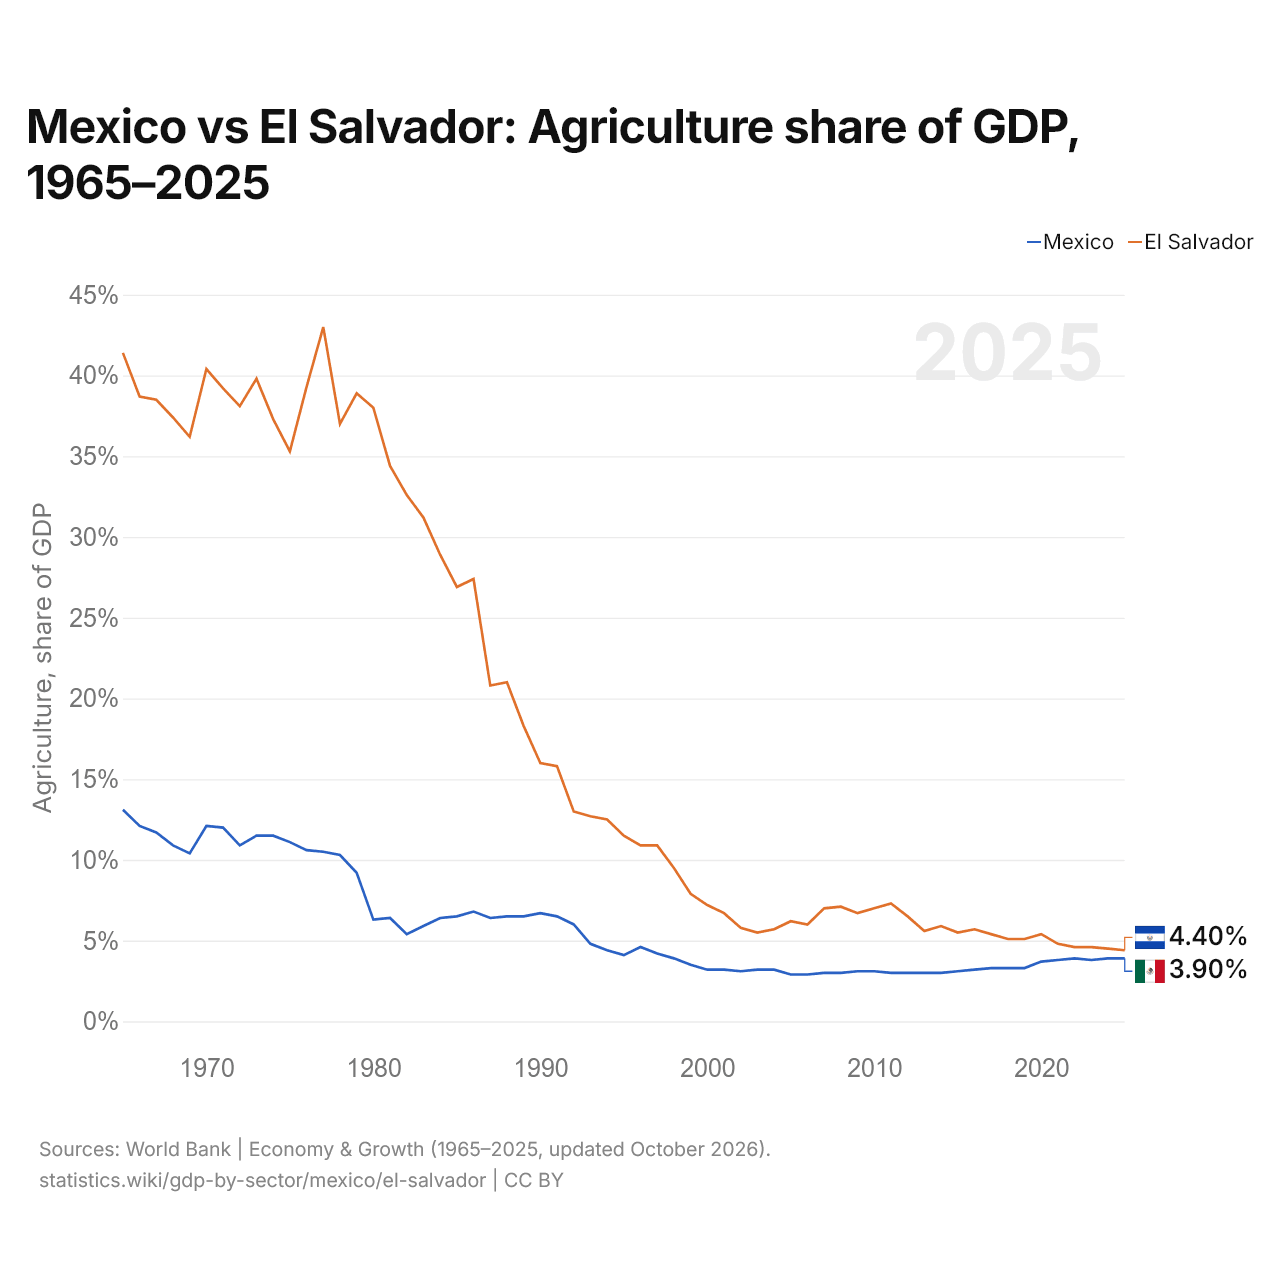
| Year | Agriculture, share of GDP | |
|---|---|---|
|
Mexico
|
El Salvador
|
|
| 2025 | 3.9% | 4.4% |
| 2024 | 3.9% | 4.5% |
| 2023 | 3.8% | 4.6% |
| 2022 | 3.9% | 4.6% |
| 2021 | 3.8% | 4.8% |
| 2020 | 3.7% | 5.4% |
| 2019 | 3.3% | 5.1% |
| 2018 | 3.3% | 5.1% |
| 2017 | 3.3% | 5.4% |
| 2016 | 3.2% | 5.7% |
| 2015 | 3.1% | 5.5% |
| 2014 | 3% | 5.9% |
| 2013 | 3% | 5.6% |
| 2012 | 3% | 6.5% |
| 2011 | 3% | 7.3% |
| 2010 | 3.1% | 7% |
| 2009 | 3.1% | 6.7% |
| 2008 | 3% | 7.1% |
| 2007 | 3% | 7% |
| 2006 | 2.9% | 6% |
| 2005 | 2.9% | 6.2% |
| 2004 | 3.2% | 5.7% |
| 2003 | 3.2% | 5.5% |
| 2002 | 3.1% | 5.8% |
| 2001 | 3.2% | 6.7% |
| 2000 | 3.2% | 7.2% |
| 1999 | 3.5% | 7.9% |
| 1998 | 3.9% | 9.5% |
| 1997 | 4.2% | 10.9% |
| 1996 | 4.6% | 10.9% |
| 1995 | 4.1% | 11.5% |
| 1994 | 4.4% | 12.5% |
| 1993 | 4.8% | 12.7% |
| 1992 | 6% | 13% |
| 1991 | 6.5% | 15.8% |
| 1990 | 6.7% | 16% |
| 1989 | 6.5% | 18.3% |
| 1988 | 6.5% | 21% |
| 1987 | 6.4% | 20.8% |
| 1986 | 6.8% | 27.4% |
| 1985 | 6.5% | 26.9% |
| 1984 | 6.4% | 28.9% |
| 1983 | 5.9% | 31.2% |
| 1982 | 5.4% | 32.6% |
| 1981 | 6.4% | 34.4% |
| 1980 | 6.3% | 38% |
| 1979 | 9.2% | 38.9% |
| 1978 | 10.3% | 37% |
| 1977 | 10.5% | 43% |
| 1976 | 10.6% | 39.3% |
| 1975 | 11.1% | 35.3% |
| 1974 | 11.5% | 37.3% |
| 1973 | 11.5% | 39.8% |
| 1972 | 10.9% | 38.1% |
| 1971 | 12% | 39.2% |
| 1970 | 12.1% | 40.4% |
| 1969 | 10.4% | 36.2% |
| 1968 | 10.9% | 37.4% |
| 1967 | 11.7% | 38.5% |
| 1966 | 12.1% | 38.7% |
| 1965 | 13.1% | 41.4% |
In 2025, services made up 58.9% of GDP in Mexico and 58.9% in El Salvador. Industry made up 30.6% and 24.5%, agriculture 3.9% and 4.4%. In 2015, services made up 60.5% of GDP in Mexico and 60.0% in El Salvador.
Mexico vs El Salvador: share of each sector in GDP
|
Mexico
|
El Salvador
|
|
|---|---|---|
| Agriculture, 2025 | 3.9% | 4.4% |
| Industry, 2025 | 30.6% | 24.5% |
| Services, 2025 | 58.9% | 58.9% |
| Agriculture, 1990 | 6.7% | 16.0% |
| Industry, 1990 | 26.1% | 23.3% |
| Services, 1990 | 59.7% | 54.7% |
Compare the GDP by sector of any 2 countries
Sources:
- World Bank | Economy & Growth (1965–2025, updated October 2026)
Creative Commons Attribution (CC BY): you may copy, share, adapt and reuse this content, also commercially, as long as you credit statistics.wiki and note any changes you made. The sources listed above may have their own license terms.