
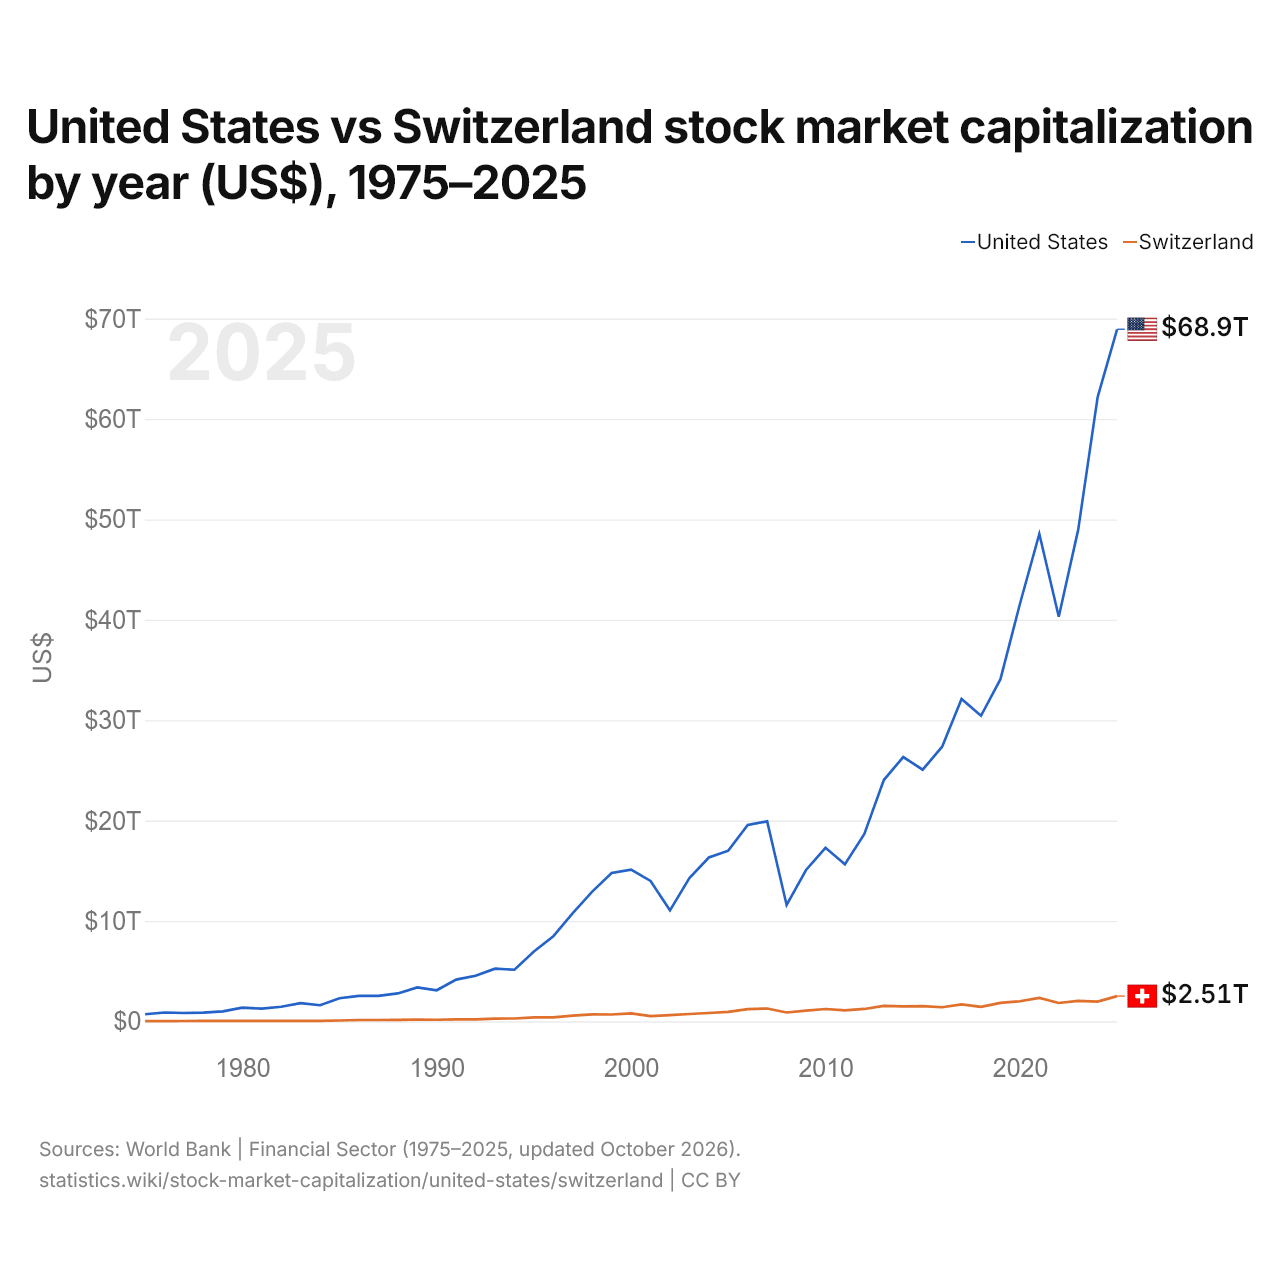
États-Unis vs Suisse : capitalisation boursière par année ($ US), 1975–2025
| Année | $ US | |
|---|---|---|
 États-Unis |
 Suisse |
|
| 2025 | 68 937 866 210 000 $ US | 2 514 307 680 000 $ US |
| 2024 | 62 185 685 320 000 $ US | 1 971 411 690 000 $ US |
| 2023 | 48 979 397 700 000 $ US | 2 044 693 280 000 $ US |
| 2022 | 40 297 980 320 000 $ US | 1 830 524 610 000 $ US |
| 2021 | 48 548 538 120 000 $ US | 2 327 707 010 000 $ US |
| 2020 | 41 569 861 770 000 $ US | 2 001 602 870 000 $ US |
| 2019 | 34 085 727 370 000 $ US | 1 834 453 260 000 $ US |
| 2018 | 30 436 313 050 000 $ US | 1 441 160 480 000 $ US |
| 2017 | 32 120 702 650 000 $ US | 1 686 497 070 000 $ US |
| 2016 | 27 352 200 720 000 $ US | 1 403 355 611 193 $ US |
| 2015 | 25 067 539 600 000 $ US | 1 519 323 460 000 $ US |
| 2014 | 26 330 589 190 000 $ US | 1 495 314 200 000 $ US |
| 2013 | 24 034 853 520 000 $ US | 1 540 699 830 000 $ US |
| 2012 | 18 668 333 210 000 $ US | 1 233 438 940 000 $ US |
| 2011 | 15 640 707 040 000 $ US | 1 089 519 370 000 $ US |
| 2010 | 17 283 451 680 000 $ US | 1 229 356 540 000 $ US |
| 2009 | 15 077 285 740 000 $ US | 1 064 686 540 000 $ US |
| 2008 | 11 590 277 780 000 $ US | 880 334 430 000 $ US |
| 2007 | 19 922 279 820 000 $ US | 1 274 656 700 000 $ US |
| 2006 | 19 568 972 500 000 $ US | 1 212 534 300 000 $ US |
| 2005 | 17 000 864 470 000 $ US | 938 697 660 000 $ US |
| 2004 | 16 323 726 330 000 $ US | 829 098 070 000 $ US |
| 2003 | 14 266 265 650 000 $ US | 727 102 780 000 $ US |
| 2002 | 11 054 430 000 000 $ US | 612 667 140 000 $ US |
| 2001 | 13 983 666 000 000 $ US | 527 355 900 000 $ US |
| 2000 | 15 107 751 000 000 $ US | 792 315 950 000 $ US |
| 1999 | 14 777 387 400 000 $ US | 678 232 020 000 $ US |
| 1998 | 12 922 580 000 000 $ US | 689 199 130 000 $ US |
| 1997 | 10 770 143 000 000 $ US | 575 339 370 000 $ US |
| 1996 | 8 480 497 000 000 $ US | 400 284 680 000 $ US |
| 1995 | 6 952 026 000 000 $ US | 398 102 020 000 $ US |
| 1994 | 5 137 739 860 000 $ US | 284 976 880 000 $ US |
| 1993 | 5 251 079 630 000 $ US | 270 879 230 000 $ US |
| 1992 | 4 545 844 000 000 $ US | 194 138 100 000 $ US |
| 1991 | 4 159 595 200 000 $ US | 189 677 500 000 $ US |
| 1990 | 3 093 448 500 000 $ US | 157 634 580 000 $ US |
| 1989 | 3 382 233 600 000 $ US | 170 935 860 000 $ US |
| 1988 | 2 779 940 700 000 $ US | 140 341 950 000 $ US |
| 1987 | 2 531 767 700 000 $ US | 129 706 030 000 $ US |
| 1986 | 2 537 942 200 000 $ US | 128 648 170 000 $ US |
| 1985 | 2 300 857 900 000 $ US | 84 104 980 000 $ US |
| 1984 | 1 602 159 700 000 $ US | 40 077 370 000 $ US |
| 1983 | 1 809 034 400 000 $ US | 44 081 170 000 $ US |
| 1982 | 1 456 865 200 000 $ US | 38 745 600 000 $ US |
| 1981 | 1 263 560 700 000 $ US | 38 347 160 000 $ US |
| 1980 | 1 359 797 800 000 $ US | 42 730 940 000 $ US |
| 1979 | 993 590 900 000 $ US | 43 569 560 000 $ US |
| 1978 | 861 961 000 000 $ US | 38 052 230 000 $ US |
| 1977 | 834 238 000 000 $ US | 29 858 100 000 $ US |
| 1976 | 883 100 000 000 $ US | 20 899 900 000 $ US |
| 1975 | 703 800 000 000 $ US | 16 469 560 000 $ US |
En 2025, les sociétés cotées valaient 68,9 billions de dollars aux États-Unis et 2,51 billions de dollars en Suisse : 27 fois plus aux États-Unis. En 1975, les sociétés cotées valaient 43 fois plus aux États-Unis : 704 milliards de dollars aux États-Unis et 16,5 milliards de dollars en Suisse.
La capitalisation boursière des sociétés nationales cotées aux États-Unis est supérieure à celle des sociétés cotées en Suisse chaque année depuis 1975.
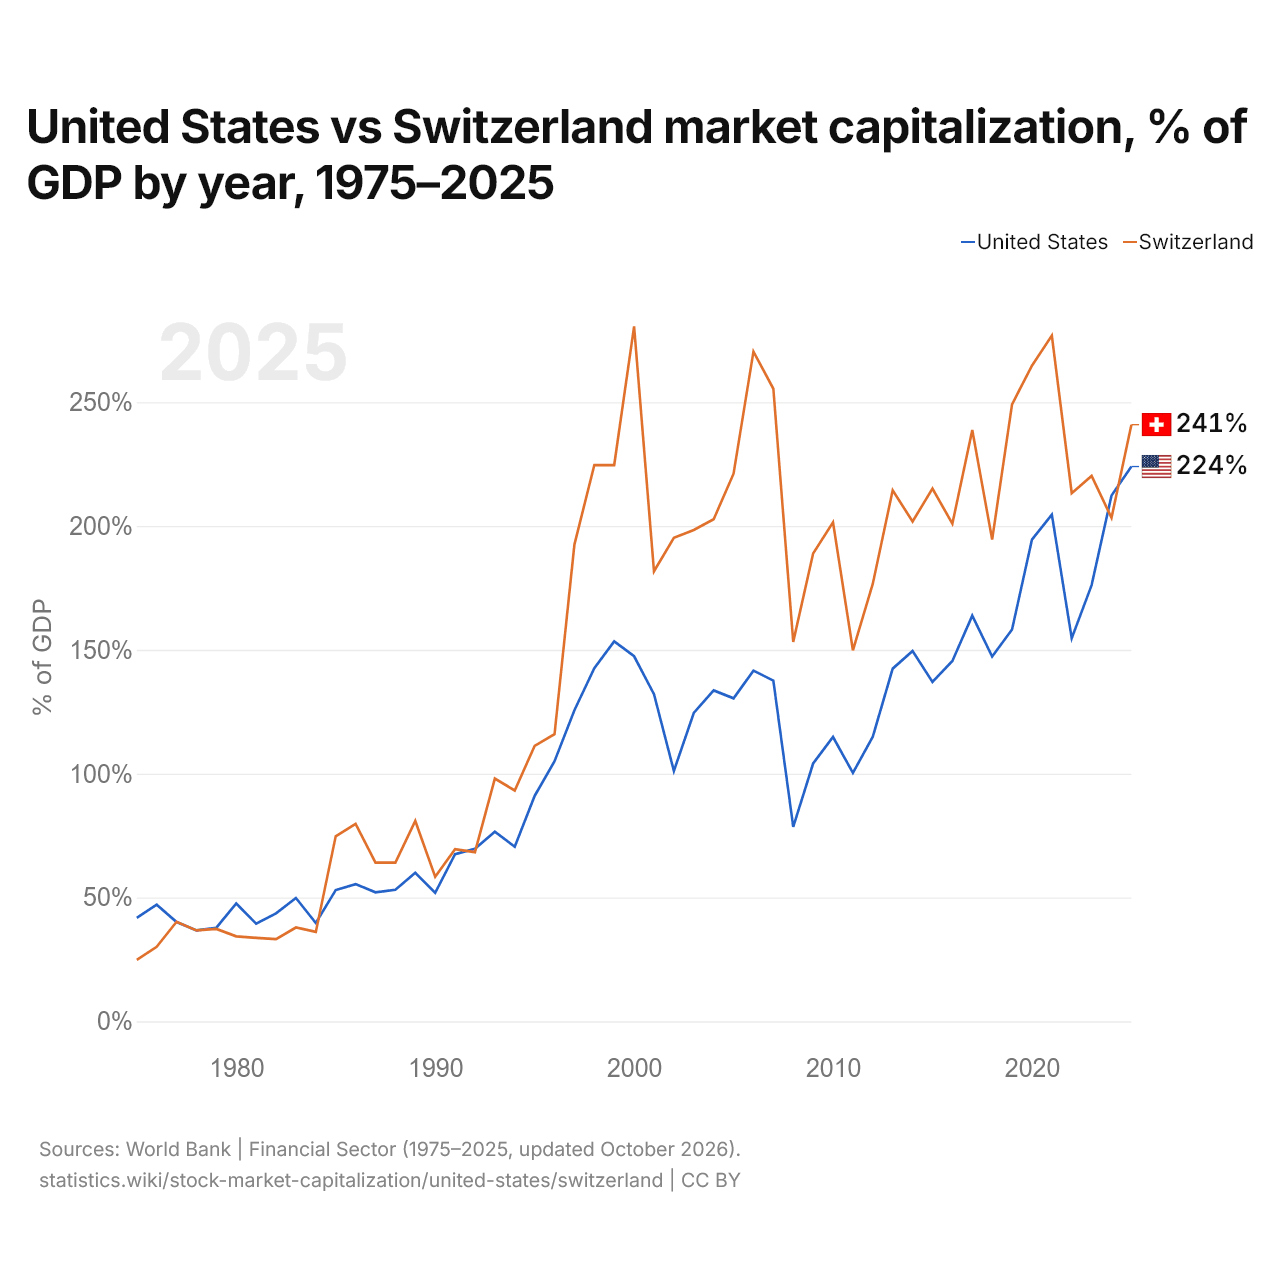
États-Unis vs Suisse : capitalisation boursière, % du PIB par année, 1975–2025
| Année | % du PIB | |
|---|---|---|
|
États-Unis
|
Suisse
|
|
| 2025 | 224 % | 240,9 % |
| 2024 | 212,3 % | 203,3 % |
| 2023 | 176,1 % | 220,2 % |
| 2022 | 154,7 % | 213,2 % |
| 2021 | 204,6 % | 276,9 % |
| 2020 | 194,5 % | 264,7 % |
| 2019 | 158,2 % | 249,1 % |
| 2018 | 147,3 % | 194,5 % |
| 2017 | 163,8 % | 238,7 % |
| 2016 | 145,5 % | 200,9 % |
| 2015 | 137 % | 215,1 % |
| 2014 | 149,5 % | 201,8 % |
| 2013 | 142,4 % | 214,4 % |
| 2012 | 114,9 % | 176,7 % |
| 2011 | 100,3 % | 149,8 % |
| 2010 | 114,8 % | 201,5 % |
| 2009 | 104,1 % | 188,9 % |
| 2008 | 78,5 % | 153,2 % |
| 2007 | 137,6 % | 255,4 % |
| 2006 | 141,6 % | 270,4 % |
| 2005 | 130,4 % | 221,1 % |
| 2004 | 133,6 % | 202,7 % |
| 2003 | 124,5 % | 198,4 % |
| 2002 | 101,1 % | 195,2 % |
| 2001 | 132,1 % | 181,7 % |
| 2000 | 147,4 % | 280,6 % |
| 1999 | 153,4 % | 224,6 % |
| 1998 | 142,6 % | 224,6 % |
| 1997 | 125,6 % | 192,5 % |
| 1996 | 105 % | 115,9 % |
| 1995 | 91 % | 111,2 % |
| 1994 | 70,5 % | 93,2 % |
| 1993 | 76,6 % | 98 % |
| 1992 | 69,7 % | 68,3 % |
| 1991 | 67,5 % | 69,5 % |
| 1990 | 51,9 % | 58,4 % |
| 1989 | 60 % | 80,9 % |
| 1988 | 53,1 % | 64,1 % |
| 1987 | 52,1 % | 64,1 % |
| 1986 | 55,4 % | 79,7 % |
| 1985 | 53 % | 74,7 % |
| 1984 | 39,7 % | 36,1 % |
| 1983 | 49,8 % | 37,9 % |
| 1982 | 43,6 % | 33,2 % |
| 1981 | 39,4 % | 33,7 % |
| 1980 | 47,6 % | 34,3 % |
| 1979 | 37,8 % | 37,3 % |
| 1978 | 36,7 % | 36,7 % |
| 1977 | 40,1 % | 40,2 % |
| 1976 | 47,1 % | 30,1 % |
| 1975 | 41,8 % | 24,8 % |
En 2025, la capitalisation boursière équivalait à 224,0 % du PIB aux États-Unis et à 240,9 % en Suisse : 16,9 points de pourcentage de plus en Suisse. En 2015, les parts étaient de 137,0 % aux États-Unis et de 215,1 % en Suisse, soit 78,1 points de pourcentage de plus en Suisse.
États-Unis vs Suisse : dernière capitalisation boursière et sociétés cotées
|
États-Unis
|
Suisse
|
|
|---|---|---|
| Capitalisation boursière | 68,9 Bn $US | 2,51 Bn $US |
| % du PIB | 224,0 % | 240,9 % |
| Sociétés nationales cotées | 3 908 | 201 |
| Rang mondial | 1/77 | 9/77 |
| Écart de capitalisation boursière | 27× | 0,036× |
Comparer la capitalisation boursière de 2 pays au choix
Sources :
- Banque mondiale | Secteur financier (1975–2025, mis à jour en octobre 2026)
Creative Commons Attribution (CC BY) : vous pouvez copier, partager, adapter et réutiliser ce contenu, y compris à des fins commerciales, à condition de citer statistics.wiki et d’indiquer les modifications apportées. Les sources citées ci-dessus peuvent avoir leurs propres conditions de licence.