
Capitalisation boursière des sociétés nationales cotées par pays, 2025
| Rang | Pays | Capitalisation boursière | % du PIB | Sociétés nationales cotées |
|---|---|---|---|---|
| 1 |  États-Unis |
68,9 Bn $US | 224,0 % | 3 908 |
| 2 |  Chine |
15,5 Bn $US | 79,5 % | 11 149 |
| 3 |  Japon |
7,61 Bn $US | 171,6 % | 3 942 |
| 4 |  Inde |
5,13 Bn $US (2024) | 136,4 % | 2 673 |
| 5 |  Canada |
4,62 Bn $US | 199,2 % | 4 377 |
| 6 |  Royaume-Uni |
3,10 Bn $US (2022) | 97,3 % | 1 606 |
| 7 |  Allemagne |
2,90 Bn $US | 57,4 % | 416 |
| 8 |  Corée du Sud |
2,76 Bn $US | 147,2 % | 2 653 |
| 9 |  Suisse |
2,51 Bn $US | 240,9 % | 201 |
| 10 |  Arabie saoudite |
2,36 Bn $US | 184,7 % | 391 |
| 11 |  Australie |
2,05 Bn $US | 113,9 % | 1 782 |
| 12 |  Afrique du Sud |
1,40 Bn $US | 327,2 % | 212 |
| 13 |  Espagne |
1,30 Bn $US | 68,1 % | 272 |
| 14 |  EAU |
1,11 Bn $US | n.d. | 153 |
| 15 |  Indonésie |
950 Md $US | 65,7 % | 956 |
| 16 |  Brésil |
871 Md $US | 38,2 % | 357 |
| 17 |  Singapour |
824 Md $US | 136,5 % | 394 |
| 18 |  Russie |
650 Md $US (2023) | 31,8 % | 194 |
| 19 |  Mexique |
560 Md $US | 30,6 % | 129 (2024) |
| 20 |  Thaïlande |
512 Md $US | 88,8 % | 868 |
| 21 |  Malaisie |
487 Md $US | 103,2 % | 1 072 |
| 22 |  Chili |
487 Md $US | 136,2 % | 433 |
| 23 |  Turquie |
404 Md $US | 25,3 % | 569 |
| 24 |  Israël |
331 Md $US (2024) | 61,0 % | 511 |
| 25 |  Pologne |
316 Md $US | 30,6 % | 737 |
| 26 |  Vietnam |
316 Md $US | 61,4 % | 400 |
| 27 |  Philippines |
232 Md $US | 47,6 % | 279 |
| 28 |  Autriche |
211 Md $US | 36,4 % | 67 |
| 29 |  Iran |
186 Md $US | 51,2 % | 630 |
| 30 |  Qatar |
177 Md $US | 82,1 % | 54 |
| 31 |  Koweït |
172 Md $US | 109,5 % | 135 |
| 32 |  Kazakhstan |
158 Md $US | 51,7 % | 80 |
| 33 |  Colombie |
133 Md $US | 29,0 % | 61 |
| 34 |  Grèce |
129 Md $US | 46,0 % | 139 |
| 35 |  Maroc |
114 Md $US | 62,5 % | 78 |
| 36 |  Pérou |
105 Md $US | 31,4 % | 176 |
| 37 |  Nouvelle-Zélande |
103 Md $US | 39,1 % | 106 |
| 38 |  Nigeria |
86,9 Md $US | 29,9 % | 165 |
| 39 |  Roumanie |
70,9 Md $US | 16,5 % | 83 |
| 40 |  Pakistan |
70,3 Md $US | 17,3 % | 535 |
| 41 |  Luxembourg |
69,4 Md $US | 68,6 % | 28 |
| 42 |  Égypte |
62,9 Md $US | 17,2 % | 244 |
| 43 |  Hongrie |
62,6 Md $US | 25,4 % | 70 |
| 44 |  Tchéquie |
55,4 Md $US | 14,2 % | 26 |
| 45 |  Argentine |
52,9 Md $US (2022) | 8,4 % | 85 (2021) |
| 46 |  Oman |
41,3 Md $US | 37,7 % | 108 |
| 47 |  Croatie |
37,9 Md $US | 36,1 % | 81 |
| 48 |  Jordanie |
37,4 Md $US | 60,7 % | 162 |
| 49 |  Chypre |
27,9 Md $US | 67,7 % | 87 |
| 50 |  Panama |
27,2 Md $US | 30,0 % | 40 |
| 51 |  Bangladesh |
26,2 Md $US | 5,7 % | 360 |
| 52 |  Sri Lanka |
26,1 Md $US | 24,0 % | 288 |
| 53 |  Ouzbékistan |
23,7 Md $US | 16,1 % | 85 |
| 54 |  Kenya |
22,8 Md $US | 16,8 % | 59 |
| 55 |  Bahreïn |
21,3 Md $US | 43,5 % | 39 |
| 56 |  Slovénie |
20,7 Md $US | 26,0 % | 17 |
| 57 |  Ghana |
16,4 Md $US | 14,4 % | 31 |
| 58 |  Zambie |
14,9 Md $US | 51,6 % | 20 |
| 59 |  Tunisie |
12,0 Md $US | 20,8 % | 75 |
| 60 |  Jamaïque |
11,6 Md $US | 51,0 % | 100 |
| 61 |  Bulgarie |
11,2 Md $US | 8,5 % | 203 |
| 62 |  Liban |
10,6 Md $US (2021) | 45,7 % | 10 |
| 63 |  Tanzanie |
9,78 Md $US | 10,8 % | 22 |
| 64 |  Maurice |
8,89 Md $US | 55,0 % | 92 |
| 65 |  Côte d’Ivoire |
7,33 Md $US (2020) | 11,6 % | 46 |
| 66 |  Biélorussie |
5,54 Md $US | 5,9 % | 12 |
| 67 |  Malte |
5,35 Md $US | 19,3 % | 35 |
| 68 |  Palestine |
4,94 Md $US | 28,8 % | 48 |
| 69 |  Arménie |
4,85 Md $US (2024) | 18,7 % | 12 |
| 70 |  Botswana |
4,28 Md $US | 21,5 % | 23 |
| 71 |  Rwanda |
3,20 Md $US | 19,6 % | 5 |
| 72 |  Barbade |
2,78 Md $US (2020) | 51,5 % | 15 |
| 73 |  Namibie |
2,48 Md $US (2024) | 18,2 % | 12 |
| 74 |  Costa Rica |
2,23 Md $US (2022) | 3,1 % | 9 |
| 75 |  Azerbaïdjan |
1,57 Md $US | 2,1 % | 36 |
| 76 |  Seychelles |
646 M $US | 27,1 % | 15 |
| 77 |  Îles Caïmans |
644 M $US (2020) | 11,4 % | 4 |
| Non classé : dernières données antérieures à 2020 | ||||
 France |
2,37 Bn $US (2018) | 85,1 % | 457 | |
 Pays-Bas |
1,10 Bn $US (2017) | 129,7 % | 102 | |
 Italie |
587 Md $US (2014) | 27,0 % | 290 | |
 Belgique |
321 Md $US (2018) | 59,2 % | 117 (2015) | |
 Norvège |
296 Md $US (2019) | 69,7 % | 180 (2017) | |
 Suède |
290 Md $US (2003) | 86,8 % | 278 (2002) | |
 Danemark |
151 Md $US (2004) | 60,1 % | 178 | |
 Irlande |
110 Md $US (2018) | 27,8 % | 43 | |
 Portugal |
61,9 Md $US (2018) | 25,6 % | 40 | |
 Finlande |
20,3 Md $US (2004) | 10,3 % | 134 | |
 Slovaquie |
5,38 Md $US (2014) | 5,3 % | 67 (2013) | |
 Ukraine |
4,42 Md $US (2018) | 3,4 % | 78 | |
 Serbie |
4,06 Md $US (2011) | 7,9 % | n.d. | |
 Venezuela |
3,98 Md $US (2002) | 4,3 % | 57 | |
 Trinité-et-Tobago |
3,89 Md $US (2001) | 44,1 % | n.d. | |
 Monténégro |
3,79 Md $US (2012) | 93,0 % | 112 | |
 Zimbabwe |
2,46 Md $US (1999) | 35,9 % | 69 | |
 Papouasie |
1,68 Md $US (2017) | 7,4 % | 6 (2016) | |
 Équateur |
747 M $US (2000) | 4,3 % | 26 | |
 Algérie |
371 M $US (2018) | 0,2 % | n.d. | |
 Paraguay |
313 M $US (1999) | 3,5 % | 55 | |
 Uruguay |
284 M $US (1996) | 1,4 % | 18 | |
 Eswatini |
234 M $US (2007) | 6,9 % | 6 | |
Le classement range 77 pays selon leur dernière capitalisation boursière connue : la plus élevée est celle des États-Unis (68,9 billions de dollars), la plus faible celle des Îles Caïmans (644 millions de dollars, 2020). Dans la moitié des pays, les sociétés cotées valaient moins de 70,9 milliards de dollars.
La capitalisation boursière est la valeur des actions des sociétés nationales cotées sur les bourses d'un pays : le cours de chaque action multiplié par le nombre d'actions de chaque société, en fin d'année. Les fonds d'investissement et les sociétés étrangères qui y sont cotés ne sont pas compris. Les montants sont en dollars américains courants et varient donc avec les cours et les taux de change ; la part du PIB les compare à la taille de l'économie du pays. Les pays dont le dernier chiffre a plus de cinq ans de retard sur le plus récent figurent sous le tableau, sans rang.
Carte de la capitalisation boursière par pays, 1997–2025
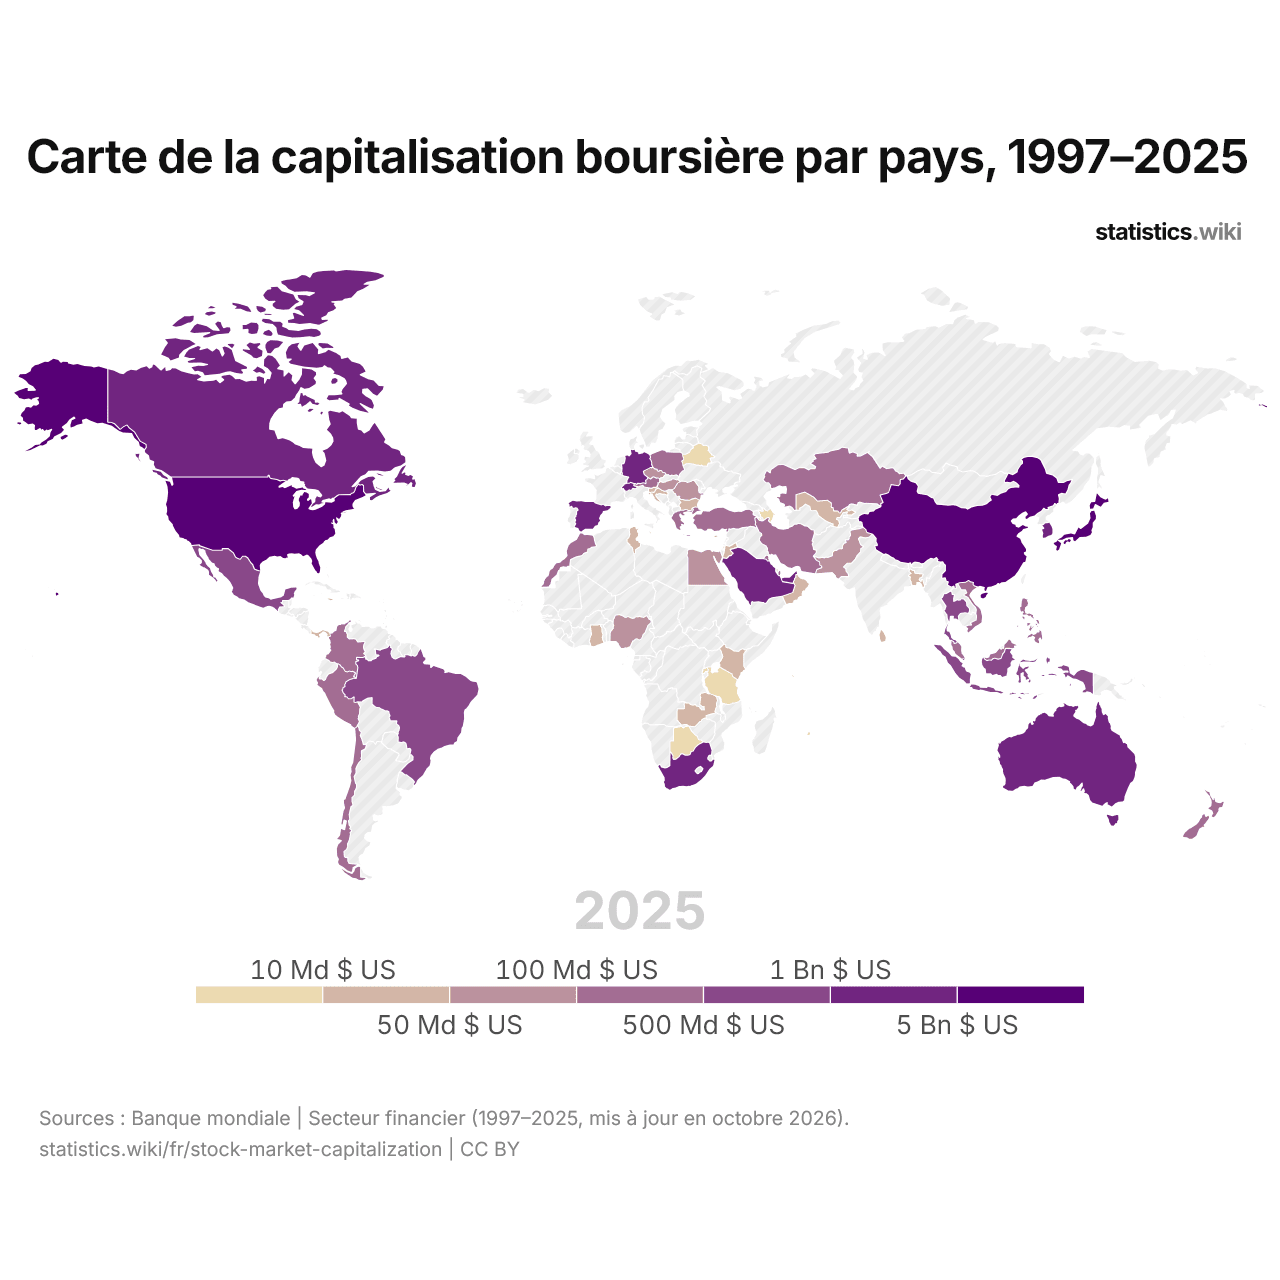
En 2025, les sociétés cotées de 12 pays valaient plus de 1 billion de dollars et celles de 9 moins de 10 milliards de dollars ; en 1997, c'était le cas de 4 et de 23.
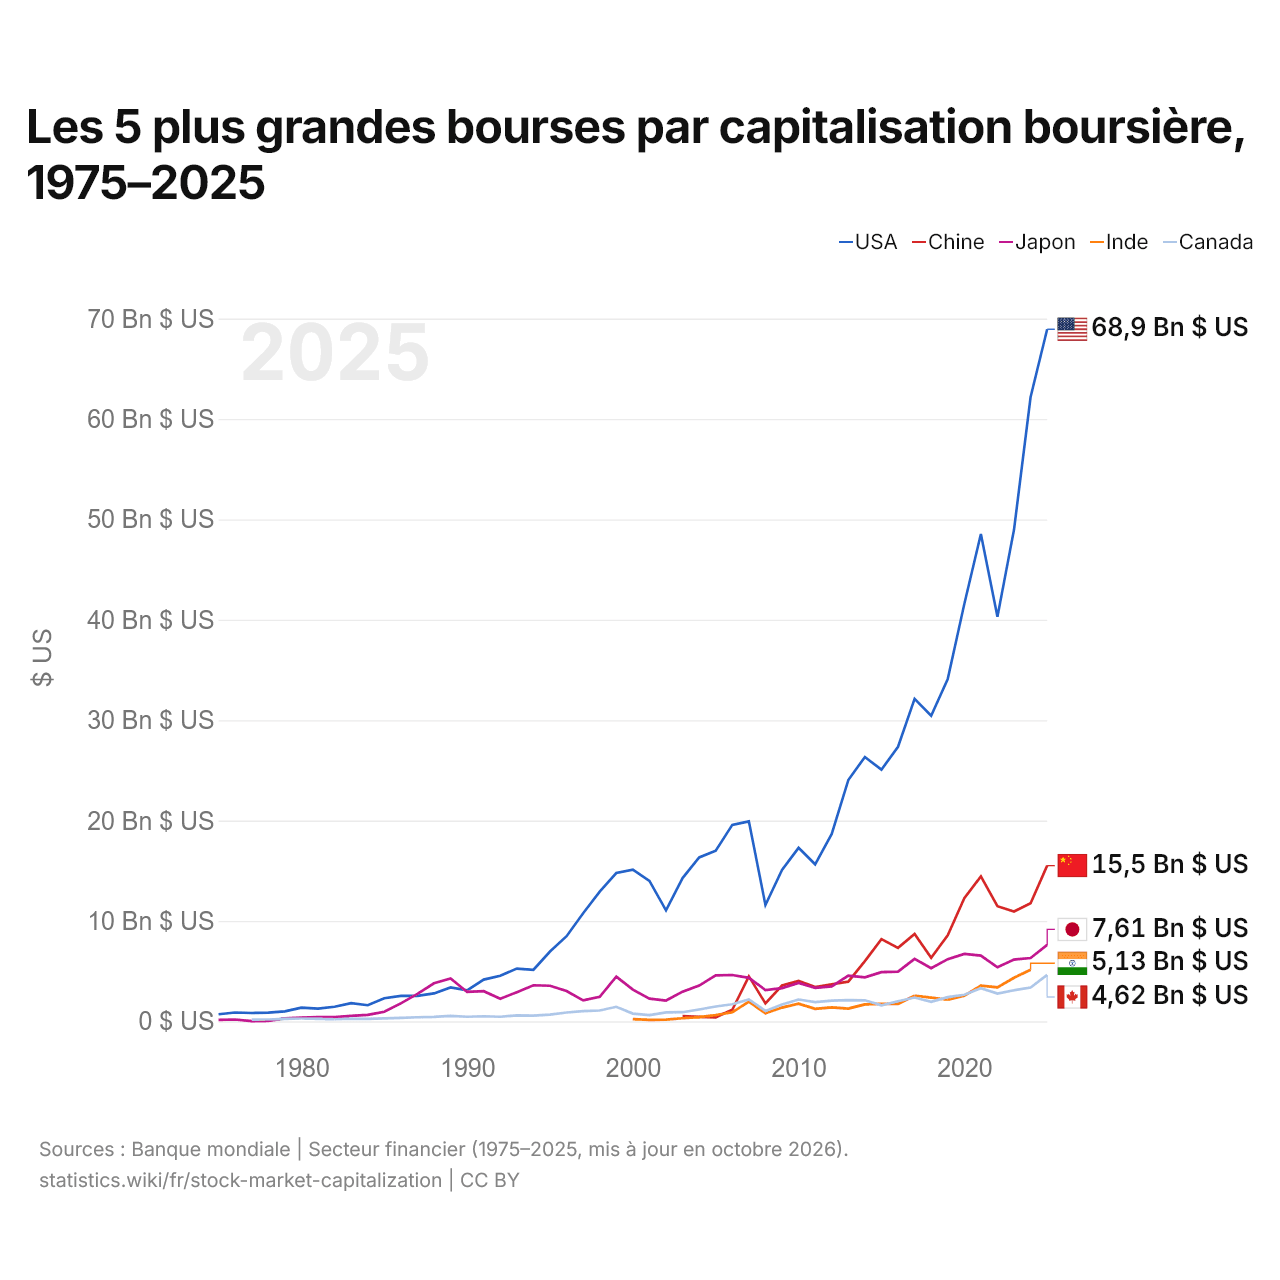
Les 5 plus grandes bourses par capitalisation boursière, 1975–2025
| Année | $ US | ||||
|---|---|---|---|---|---|
| États-Unis | Chine | Japon | Inde | Canada | |
| 2025 | 68 937 866 210 000 $ US | 15 508 858 500 000 $ US | 7 610 543 670 000 $ US | - | 4 621 231 170 000 $ US |
| 2024 | 62 185 685 320 000 $ US | 11 755 757 950 000 $ US | 6 310 681 430 000 $ US | 5 131 397 430 000 $ US | 3 374 477 170 000 $ US |
| 2023 | 48 979 397 700 000 $ US | 10 935 845 590 000 $ US | 6 149 200 180 000 $ US | 4 340 130 780 000 $ US | 3 099 135 030 000 $ US |
| 2022 | 40 297 980 320 000 $ US | 11 469 346 090 000 $ US | 5 380 475 460 000 $ US | 3 387 366 670 000 $ US | 2 760 871 360 000 $ US |
| 2021 | 48 548 538 120 000 $ US | 14 437 446 150 000 $ US | 6 544 303 490 000 $ US | 3 548 018 470 000 $ US | 3 302 816 830 000 $ US |
| 2020 | 41 569 861 770 000 $ US | 12 276 766 270 000 $ US | 6 718 219 550 000 $ US | 2 552 463 790 000 $ US | 2 641 455 040 000 $ US |
| 2019 | 34 085 727 370 000 $ US | 8 569 512 150 000 $ US | 6 191 073 290 000 $ US | 2 162 702 910 000 $ US | 2 409 098 540 000 $ US |
| 2018 | 30 436 313 050 000 $ US | 6 324 879 760 000 $ US | 5 296 811 100 000 $ US | - | 1 937 902 710 000 $ US |
| 2017 | 32 120 702 650 000 $ US | 8 711 267 220 000 $ US | 6 222 825 210 000 $ US | 2 555 988 798 538 $ US | 2 367 059 920 000 $ US |
| 2016 | 27 352 200 720 000 $ US | 7 320 738 379 789 $ US | 4 955 299 652 289 $ US | 1 746 297 399 290 $ US | 1 993 522 735 730 $ US |
| 2015 | 25 067 539 600 000 $ US | 8 188 019 320 000 $ US | 4 894 919 120 000 $ US | 1 745 169 237 451 $ US | 1 593 399 300 000 $ US |
| 2014 | 26 330 589 190 000 $ US | 6 004 947 670 000 $ US | 4 377 994 370 000 $ US | 1 686 708 487 025 $ US | 2 095 420 680 000 $ US |
| 2013 | 24 034 853 520 000 $ US | 3 949 143 490 000 $ US | 4 543 169 140 000 $ US | 1 265 063 578 241 $ US | 2 113 821 770 000 $ US |
| 2012 | 18 668 333 210 000 $ US | 3 697 376 040 000 $ US | 3 478 831 520 000 $ US | 1 390 416 295 255 $ US | 2 059 973 580 000 $ US |
| 2011 | 15 640 707 040 000 $ US | 3 412 108 290 000 $ US | 3 325 387 760 000 $ US | 1 244 598 654 110 $ US | 1 912 871 970 000 $ US |
| 2010 | 17 283 451 680 000 $ US | 4 027 840 300 000 $ US | 3 827 774 200 000 $ US | 1 762 461 862 599 $ US | 2 171 194 840 000 $ US |
| 2009 | 15 077 285 740 000 $ US | 3 573 152 460 000 $ US | 3 306 082 050 000 $ US | 1 367 309 893 276 $ US | 1 677 431 720 000 $ US |
| 2008 | 11 590 277 780 000 $ US | 1 778 784 040 000 $ US | 3 115 803 730 000 $ US | 791 308 008 892 $ US | 1 033 651 810 000 $ US |
| 2007 | 19 922 279 820 000 $ US | 4 478 866 530 000 $ US | 4 330 921 860 000 $ US | 1 961 859 187 267 $ US | 2 186 550 150 000 $ US |
| 2006 | 19 568 972 500 000 $ US | 1 145 454 870 000 $ US | 4 614 068 830 000 $ US | 895 269 881 904 $ US | 1 700 708 090 000 $ US |
| 2005 | 17 000 864 470 000 $ US | 401 852 250 000 $ US | 4 572 901 030 000 $ US | 624 739 583 186 $ US | 1 482 184 560 000 $ US |
| 2004 | 16 323 726 330 000 $ US | 447 720 260 000 $ US | 3 557 674 430 000 $ US | 415 544 312 811 $ US | 1 177 517 940 000 $ US |
| 2003 | 14 266 265 650 000 $ US | 512 978 770 000 $ US | 2 953 098 300 000 $ US | 308 994 959 404 $ US | 910 230 610 000 $ US |
| 2002 | 11 054 430 000 000 $ US | - | 2 069 299 120 000 $ US | 172 185 662 293 $ US | 888 677 700 000 $ US |
| 2001 | 13 983 666 000 000 $ US | - | 2 264 527 900 000 $ US | 148 771 635 310 $ US | 615 265 930 000 $ US |
| 2000 | 15 107 751 000 000 $ US | - | 3 157 221 780 000 $ US | 225 648 371 926 $ US | 770 841 540 000 $ US |
| 1999 | 14 777 387 400 000 $ US | - | 4 455 348 090 000 $ US | - | 1 448 278 090 000 $ US |
| 1998 | 12 922 580 000 000 $ US | - | 2 439 548 790 000 $ US | - | 1 081 927 730 000 $ US |
| 1997 | 10 770 143 000 000 $ US | - | 2 085 370 340 000 $ US | - | 1 010 507 310 000 $ US |
| 1996 | 8 480 497 000 000 $ US | - | 3 019 733 730 000 $ US | - | 879 797 610 000 $ US |
| 1995 | 6 952 026 000 000 $ US | - | 3 545 306 510 000 $ US | - | 671 742 800 000 $ US |
| 1994 | 5 137 739 860 000 $ US | - | 3 592 193 910 000 $ US | - | 575 716 370 000 $ US |
| 1993 | 5 251 079 630 000 $ US | - | 2 906 298 700 000 $ US | - | 595 516 360 000 $ US |
| 1992 | 4 545 844 000 000 $ US | - | 2 254 844 100 000 $ US | - | 457 949 900 000 $ US |
| 1991 | 4 159 595 200 000 $ US | - | 3 005 697 400 000 $ US | - | 508 633 200 000 $ US |
| 1990 | 3 093 448 500 000 $ US | - | 2 928 533 730 000 $ US | - | 458 678 620 000 $ US |
| 1989 | 3 382 233 600 000 $ US | - | 4 260 382 520 000 $ US | - | 543 396 610 000 $ US |
| 1988 | 2 779 940 700 000 $ US | - | 3 789 032 960 000 $ US | - | 446 806 410 000 $ US |
| 1987 | 2 531 767 700 000 $ US | - | 2 726 369 260 000 $ US | - | 405 600 860 000 $ US |
| 1986 | 2 537 942 200 000 $ US | - | 1 783 639 430 000 $ US | - | 336 895 680 000 $ US |
| 1985 | 2 300 857 900 000 $ US | - | 948 262 520 000 $ US | - | 292 880 140 000 $ US |
| 1984 | 1 602 159 700 000 $ US | - | 644 412 020 000 $ US | - | 246 632 360 000 $ US |
| 1983 | 1 809 034 400 000 $ US | - | 545 848 260 000 $ US | - | 257 634 200 000 $ US |
| 1982 | 1 456 865 200 000 $ US | - | 417 405 180 000 $ US | - | 207 092 900 000 $ US |
| 1981 | 1 263 560 700 000 $ US | - | 417 943 120 000 $ US | - | - |
| 1980 | 1 359 797 800 000 $ US | - | 379 212 790 000 $ US | - | 285 706 860 000 $ US |
| 1979 | 993 590 900 000 $ US | - | 289 123 900 000 $ US | - | 238 944 270 000 $ US |
| 1978 | 861 961 000 000 $ US | - | 34 198 150 000 $ US | - | 179 690 430 000 $ US |
| 1977 | 834 238 000 000 $ US | - | 21 530 430 000 $ US | - | 173 941 850 000 $ US |
| 1976 | 883 100 000 000 $ US | - | 180 900 950 000 $ US | - | - |
| 1975 | 703 800 000 000 $ US | - | 141 799 090 000 $ US | - | - |
En 2025, les sociétés cotées valaient 68,9 billions de dollars aux États-Unis, 15,5 billions de dollars en Chine, 7,61 billions de dollars au Japon, 5,13 billions de dollars en Inde (2024) et 4,62 billions de dollars au Canada. La bourse des États-Unis est la plus grande des cinq depuis 1990. Le changement le plus récent dans leur ordre remonte à 2021, quand la bourse de l'Inde a dépassé celle du Canada.
Les 10 pays à la plus forte capitalisation boursière en % du PIB, 2025
Les 10 pays à la plus faible capitalisation boursière en % du PIB, 2025
-
Azerbaïdjan
-
Costa Rica
-
Bangladesh
-
Biélorussie
-
Argentine
-
Bulgarie
-
Tanzanie
-
Îles Caïmans
-
Côte d’Ivoire
-
Tchéquie
En 2025, rapportée au PIB, la valeur des sociétés cotées était la plus élevée en Afrique du Sud, 327,2 % du PIB, et la plus faible en Azerbaïdjan, 2,1 %.
Les 10 plus grandes bourses chaque année, 1997–2025
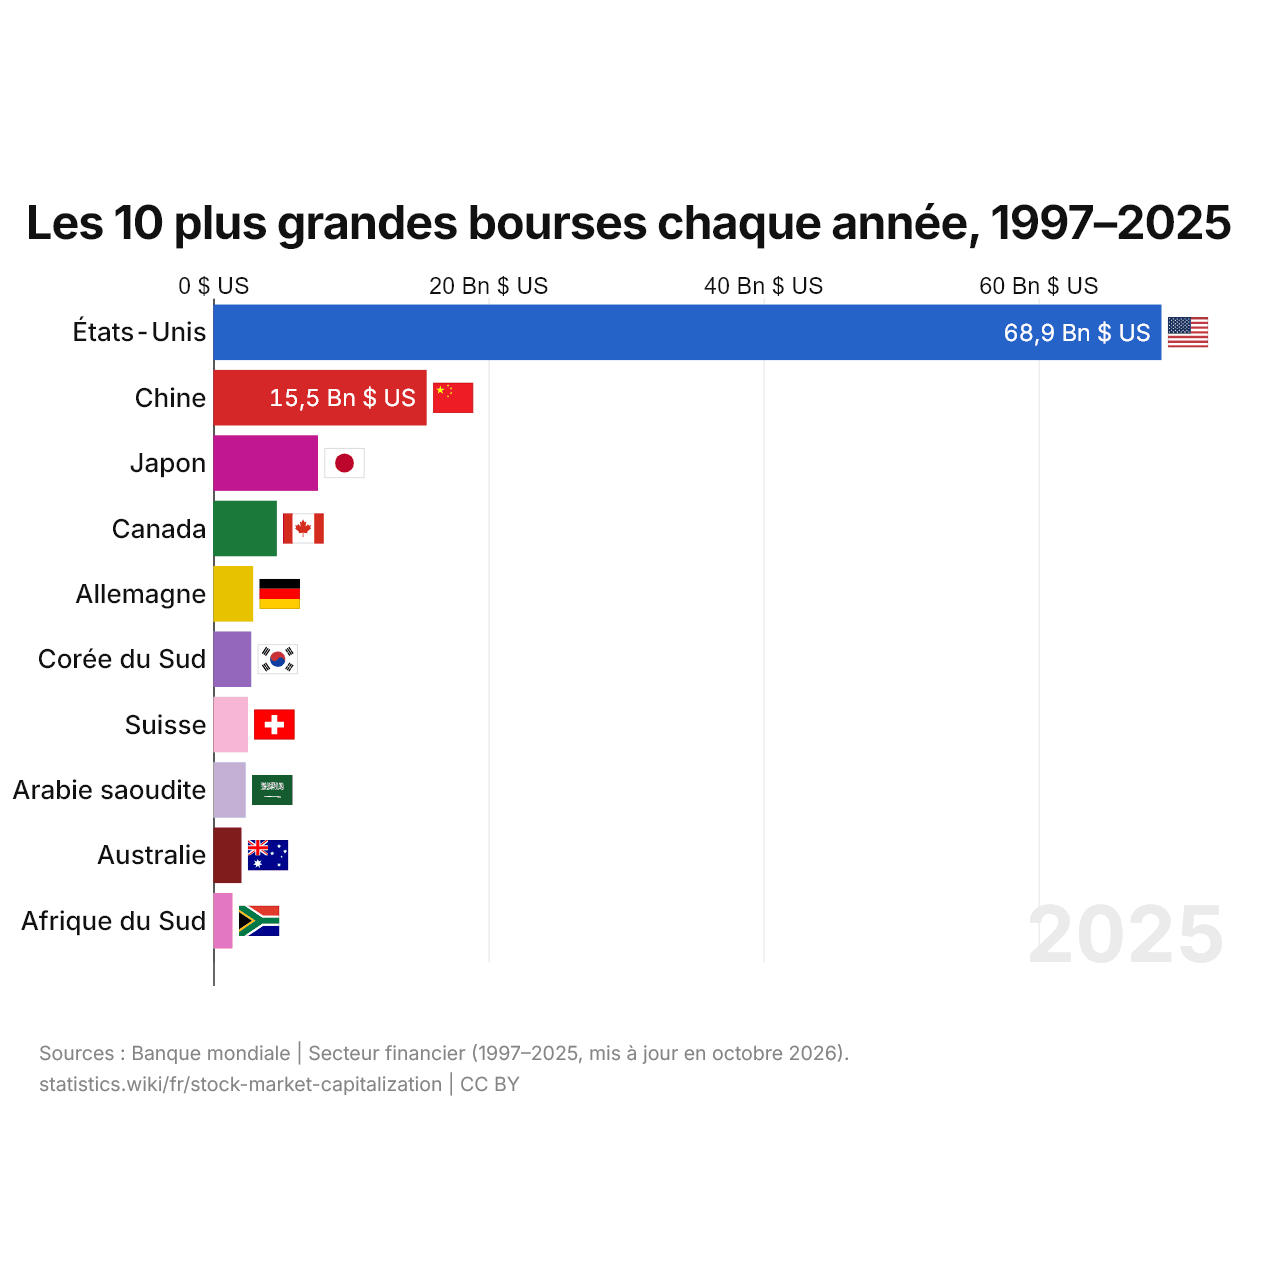
La plus grande bourse était celle des États-Unis en 1997 (10,8 billions de dollars) comme en 2025 (68,9 billions de dollars). Parmi eux, la plus forte progression est celle de la Corée du Sud : du 26e rang en 1997 au 6e en 2025.
Comparer la capitalisation boursière de 2 pays au choix
Sources :
- Banque mondiale | Secteur financier (1975–2025, mis à jour en octobre 2026)
Creative Commons Attribution (CC BY) : vous pouvez copier, partager, adapter et réutiliser ce contenu, y compris à des fins commerciales, à condition de citer statistics.wiki et d’indiquer les modifications apportées. Les sources citées ci-dessus peuvent avoir leurs propres conditions de licence.