
Royaume-Uni vs Israël : capitalisation boursière par année ($ US)
| Année | $ US | |
|---|---|---|
 Royaume-Uni |
 Israël |
|
| 2024 | - | 330 881 920 000 $ US |
| 2023 | - | 264 492 640 000 $ US |
| 2022 | 3 095 983 430 000 $ US | 269 637 290 000 $ US |
| 2021 | 3 799 459 240 000 $ US | 362 118 480 000 $ US |
| 2020 | - | 262 061 920 000 $ US |
| 2019 | - | 237 371 160 000 $ US |
| 2018 | - | 187 466 400 000 $ US |
| 2017 | - | 231 048 760 000 $ US |
| 2016 | - | 213 983 608 690 $ US |
| 2015 | - | 243 903 680 000 $ US |
| 2014 | 3 570 893 500 000 $ US | 200 524 990 000 $ US |
| 2013 | 3 946 884 730 000 $ US | 203 301 350 000 $ US |
| 2012 | 3 291 640 120 000 $ US | 161 855 480 000 $ US |
| 2011 | 2 932 240 870 000 $ US | 156 938 650 000 $ US |
| 2010 | 2 686 880 880 000 $ US | 227 614 010 000 $ US |
| 2009 | 2 796 444 320 000 $ US | 188 733 900 000 $ US |
| 2008 | 1 868 152 970 000 $ US | 107 706 440 000 $ US |
| 2007 | 3 846 461 880 000 $ US | 235 056 380 000 $ US |
| 2006 | 3 781 358 500 000 $ US | 161 731 740 000 $ US |
| 2005 | 3 058 182 420 000 $ US | 122 577 930 000 $ US |
| 2004 | 2 815 928 030 000 $ US | 91 856 250 000 $ US |
| 2003 | 2 425 822 000 000 $ US | 70 169 060 000 $ US |
| 2002 | 1 856 194 400 000 $ US | 42 131 470 000 $ US |
| 2001 | 2 149 500 800 000 $ US | 57 655 940 000 $ US |
| 2000 | 2 576 991 340 000 $ US | 66 742 920 000 $ US |
| 1999 | 2 954 815 470 000 $ US | 65 261 070 000 $ US |
| 1998 | 2 297 650 970 000 $ US | 40 883 390 000 $ US |
| 1997 | 2 068 246 130 000 $ US | 46 328 090 000 $ US |
| 1996 | 1 711 228 010 000 $ US | 35 770 280 000 $ US |
| 1995 | 1 329 936 350 000 $ US | 36 508 720 000 $ US |
| 1994 | 1 143 329 850 000 $ US | 32 732 480 000 $ US |
| 1993 | 1 150 283 390 000 $ US | 50 840 710 000 $ US |
| 1992 | 954 882 600 000 $ US | 29 698 100 000 $ US |
| 1991 | 989 917 850 000 $ US | 14 295 000 000 $ US |
| 1990 | 849 847 890 000 $ US | 8 273 930 000 $ US |
| 1989 | 814 320 650 000 $ US | 8 228 730 000 $ US |
| 1988 | 711 527 140 000 $ US | 5 420 180 000 $ US |
| 1987 | 679 711 590 000 $ US | 12 109 710 000 $ US |
| 1986 | 472 896 330 000 $ US | 9 884 280 000 $ US |
| 1985 | 353 475 370 000 $ US | 7 630 000 000 $ US |
| 1984 | 236 403 380 000 $ US | 6 120 110 000 $ US |
| 1983 | 225 836 960 000 $ US | 5 096 240 000 $ US |
| 1982 | 196 251 210 000 $ US | 15 917 340 000 $ US |
| 1981 | 189 563 060 000 $ US | 6 970 150 000 $ US |
| 1980 | 35 975 710 000 $ US | 4 808 410 000 $ US |
| 1979 | 30 095 770 000 $ US | 2 539 520 000 $ US |
| 1978 | 129 427 870 000 $ US | - |
| 1977 | 115 464 670 000 $ US | - |
| 1976 | 69 696 610 000 $ US | - |
| 1975 | 85 803 890 000 $ US | - |
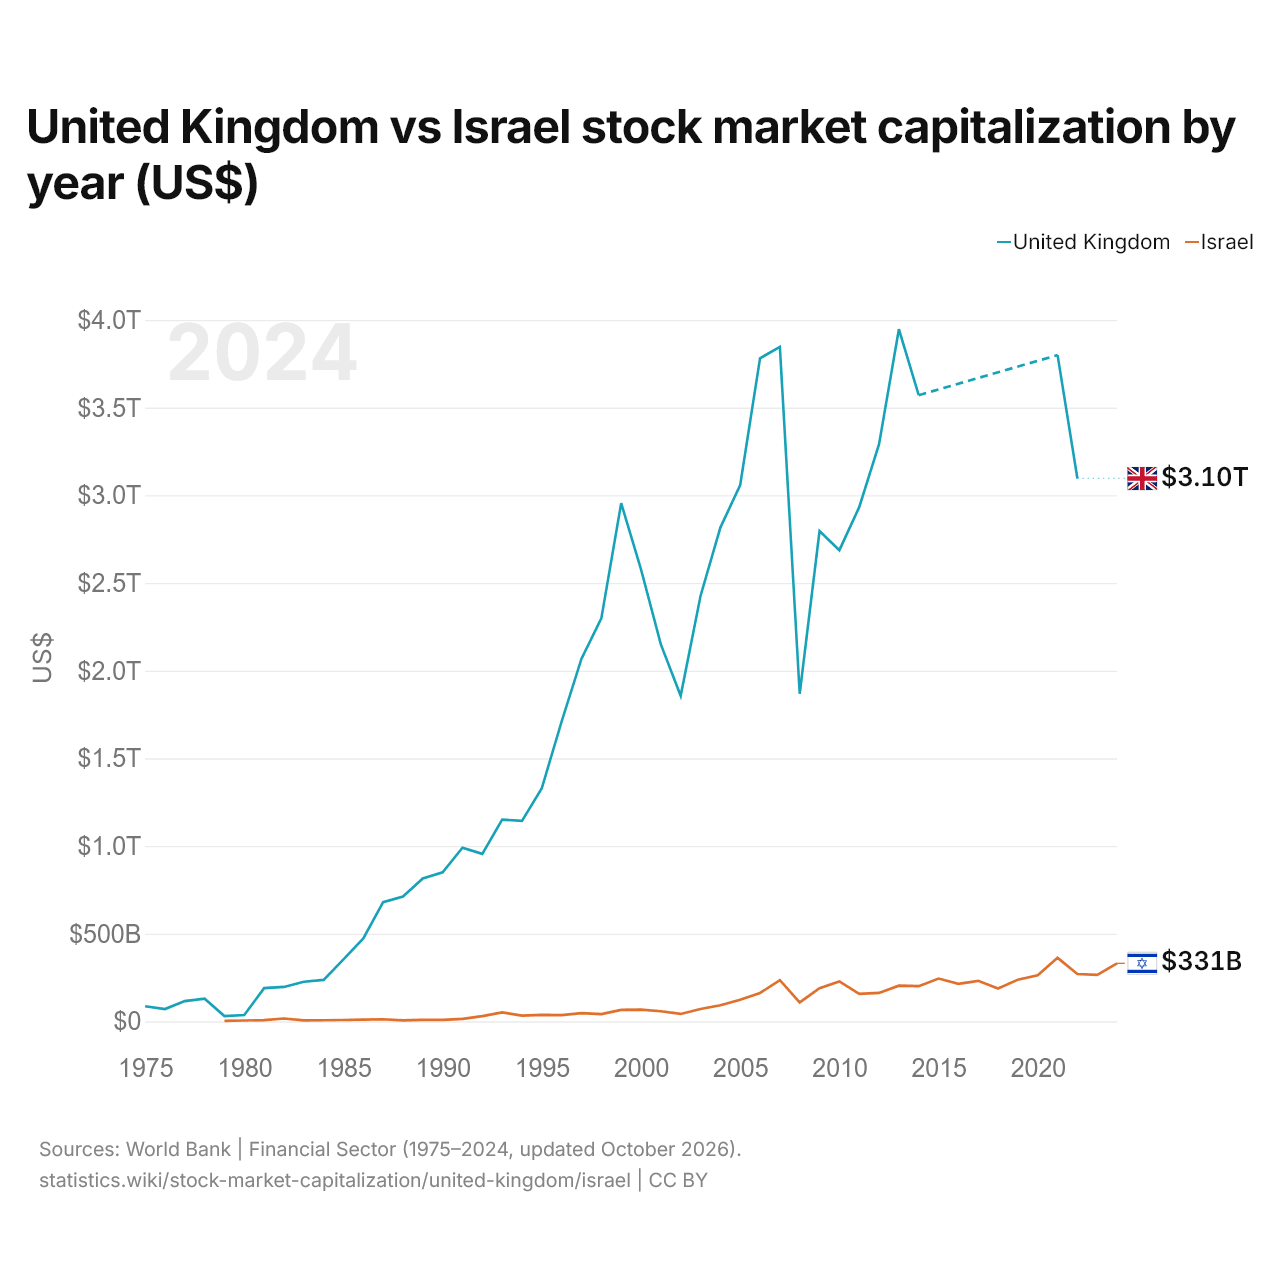
Les sociétés cotées valaient 3,1 billions de dollars au Royaume-Uni (2022) et 270 milliards de dollars en Israël (2022) : 11 fois plus au Royaume-Uni. En 1979, les sociétés cotées valaient 12 fois plus au Royaume-Uni : 30,1 milliards de dollars au Royaume-Uni et 2,54 milliards de dollars en Israël.
Royaume-Uni vs Israël : capitalisation boursière, % du PIB par année
| Année | % du PIB | |
|---|---|---|
|
Royaume-Uni
|
Israël
|
|
| 2024 | - | 61 % |
| 2023 | - | 51,5 % |
| 2022 | 97,3 % | 51,3 % |
| 2021 | 118,9 % | 73,9 % |
| 2020 | - | 63,8 % |
| 2019 | - | 59,5 % |
| 2018 | - | 49,9 % |
| 2017 | - | 64,7 % |
| 2016 | - | 66,6 % |
| 2015 | - | 80,5 % |
| 2014 | 115,7 % | 63,8 % |
| 2013 | 141,1 % | 68,2 % |
| 2012 | 121 % | 61,5 % |
| 2011 | 109,6 % | 58,6 % |
| 2010 | 107,6 % | 95,1 % |
| 2009 | 115,1 % | 88,6 % |
| 2008 | 63,4 % | 48,7 % |
| 2007 | 123,9 % | 127,4 % |
| 2006 | 139 % | 101,9 % |
| 2005 | 119,9 % | 83,2 % |
| 2004 | 115,9 % | 65,6 % |
| 2003 | 117,7 % | 53,5 % |
| 2002 | 103,7 % | 33,6 % |
| 2001 | 129,8 % | 42,7 % |
| 2000 | 154,2 % | 48,9 % |
| 1999 | 174,5 % | 53,8 % |
| 1998 | 138,3 % | 33,9 % |
| 1997 | 131,8 % | 38,8 % |
| 1996 | 120,1 % | 31,1 % |
| 1995 | 98,6 % | 34,6 % |
| 1994 | 100,2 % | 36,1 % |
| 1993 | 108,4 % | 63,7 % |
| 1992 | 80,9 % | 37,4 % |
| 1991 | 86,6 % | 20,1 % |
| 1990 | 77,7 % | 13,3 % |
| 1989 | 87,9 % | 15,7 % |
| 1988 | 78,2 % | 10,3 % |
| 1987 | 91,2 % | 28,1 % |
| 1986 | 78,6 % | 27,6 % |
| 1985 | 72,2 % | 26,4 % |
| 1984 | 51,2 % | 20 % |
| 1983 | 46,1 % | 15,6 % |
| 1982 | 38,1 % | 54,4 % |
| 1981 | 35,1 % | 25,9 % |
| 1980 | 6,4 % | 18,9 % |
| 1979 | 6,9 % | 11,2 % |
| 1978 | 38,5 % | - |
| 1977 | 43,9 % | - |
| 1976 | 30 % | - |
| 1975 | 35,5 % | - |
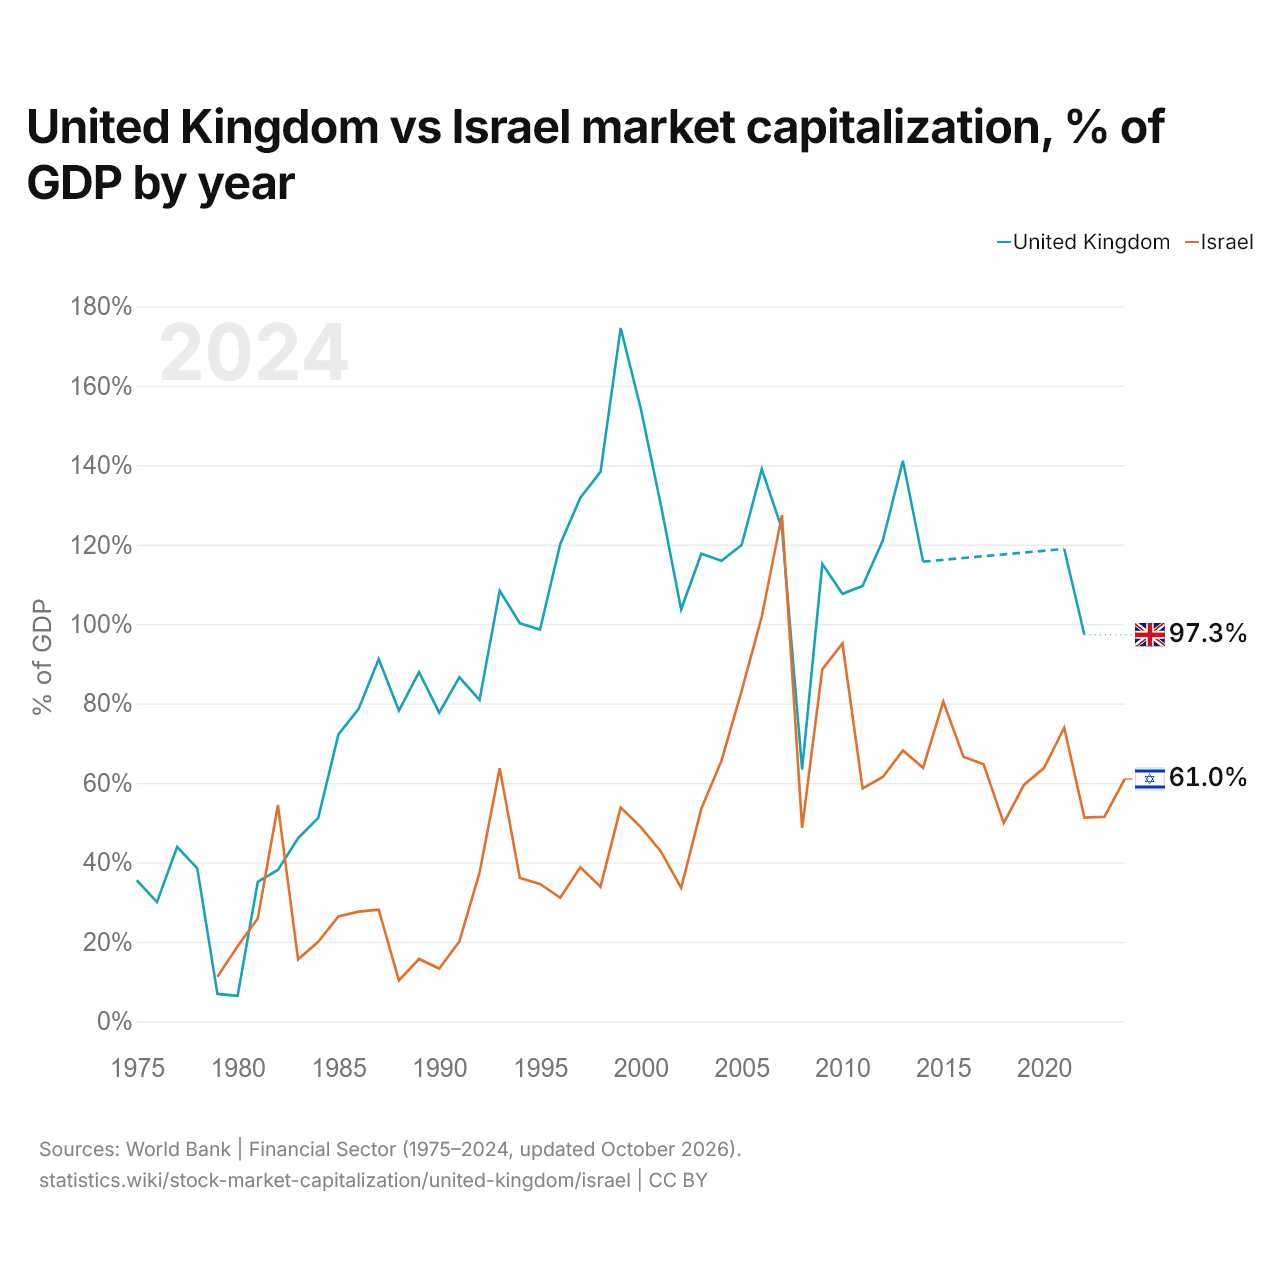
La capitalisation boursière équivalait à 97,3 % du PIB au Royaume-Uni (2022) et à 51,3 % en Israël (2022) : 46,0 points de pourcentage de plus au Royaume-Uni. En 2012, les parts étaient de 121,0 % au Royaume-Uni et de 61,5 % en Israël, soit 59,5 points de pourcentage de plus au Royaume-Uni.
Royaume-Uni vs Israël : dernière capitalisation boursière et sociétés cotées
|
Royaume-Uni
|
Israël
|
|
|---|---|---|
| Capitalisation boursière | 3,10 Bn $US (2022) | 331 Md $US (2024) |
| % du PIB | 97,3 % (2022) | 61,0 % (2024) |
| Sociétés nationales cotées | 1 606 (2022) | 511 (2024) |
| Rang mondial | 6/77 | 24/77 |
Comparer la capitalisation boursière de 2 pays au choix
Sources :
- Banque mondiale | Secteur financier (1975–2024, mis à jour en octobre 2026)
Creative Commons Attribution (CC BY) : vous pouvez copier, partager, adapter et réutiliser ce contenu, y compris à des fins commerciales, à condition de citer statistics.wiki et d’indiquer les modifications apportées. Les sources citées ci-dessus peuvent avoir leurs propres conditions de licence.