
Corée du Sud vs Japon : capitalisation boursière par année ($ US), 1975–2025
| Année | $ US | |
|---|---|---|
 Corée du Sud |
 Japon |
|
| 2025 | 2 756 667 490 000 $ US | 7 610 543 670 000 $ US |
| 2024 | 1 557 487 560 000 $ US | 6 310 681 430 000 $ US |
| 2023 | 1 967 998 300 000 $ US | 6 149 200 180 000 $ US |
| 2022 | 1 644 507 580 000 $ US | 5 380 475 460 000 $ US |
| 2021 | 2 218 658 140 000 $ US | 6 544 303 490 000 $ US |
| 2020 | 2 176 189 500 000 $ US | 6 718 219 550 000 $ US |
| 2019 | 1 484 840 320 000 $ US | 6 191 073 290 000 $ US |
| 2018 | 1 413 716 510 000 $ US | 5 296 811 100 000 $ US |
| 2017 | 1 771 767 930 000 $ US | 6 222 825 210 000 $ US |
| 2016 | 1 254 541 184 535 $ US | 4 955 299 652 289 $ US |
| 2015 | 1 231 199 760 000 $ US | 4 894 919 120 000 $ US |
| 2014 | 1 212 759 460 000 $ US | 4 377 994 370 000 $ US |
| 2013 | 1 234 548 550 000 $ US | 4 543 169 140 000 $ US |
| 2012 | 1 179 419 470 000 $ US | 3 478 831 520 000 $ US |
| 2011 | 996 139 920 000 $ US | 3 325 387 760 000 $ US |
| 2010 | 1 091 911 460 000 $ US | 3 827 774 200 000 $ US |
| 2009 | 834 596 860 000 $ US | 3 306 082 050 000 $ US |
| 2008 | 470 797 680 000 $ US | 3 115 803 730 000 $ US |
| 2007 | 1 122 606 330 000 $ US | 4 330 921 860 000 $ US |
| 2006 | 834 404 280 000 $ US | 4 614 068 830 000 $ US |
| 2005 | 718 010 710 000 $ US | 4 572 901 030 000 $ US |
| 2004 | 428 325 580 000 $ US | 3 557 674 430 000 $ US |
| 2003 | 329 457 320 000 $ US | 2 953 098 300 000 $ US |
| 2002 | 250 706 770 000 $ US | 2 069 299 120 000 $ US |
| 2001 | 233 920 540 000 $ US | 2 264 527 900 000 $ US |
| 2000 | 171 262 310 000 $ US | 3 157 221 780 000 $ US |
| 1999 | 306 127 530 000 $ US | 4 455 348 090 000 $ US |
| 1998 | 114 593 310 000 $ US | 2 439 548 790 000 $ US |
| 1997 | 41 881 360 000 $ US | 2 085 370 340 000 $ US |
| 1996 | 139 121 660 000 $ US | 3 019 733 730 000 $ US |
| 1995 | 181 954 750 000 $ US | 3 545 306 510 000 $ US |
| 1994 | 191 778 110 000 $ US | 3 592 193 910 000 $ US |
| 1993 | 139 583 870 000 $ US | 2 906 298 700 000 $ US |
| 1992 | 107 661 100 000 $ US | 2 254 844 100 000 $ US |
| 1991 | 96 466 000 000 $ US | 3 005 697 400 000 $ US |
| 1990 | 110 301 060 000 $ US | 2 928 533 730 000 $ US |
| 1989 | 140 489 660 000 $ US | 4 260 382 520 000 $ US |
| 1988 | 94 348 320 000 $ US | 3 789 032 960 000 $ US |
| 1987 | 33 033 160 000 $ US | 2 726 369 260 000 $ US |
| 1986 | 13 924 110 000 $ US | 1 783 639 430 000 $ US |
| 1985 | 7 380 820 000 $ US | 948 262 520 000 $ US |
| 1984 | 6 222 380 000 $ US | 644 412 020 000 $ US |
| 1983 | 4 386 800 000 $ US | 545 848 260 000 $ US |
| 1982 | 4 407 720 000 $ US | 417 405 180 000 $ US |
| 1981 | 4 224 270 000 $ US | 417 943 120 000 $ US |
| 1980 | 3 828 760 000 $ US | 379 212 790 000 $ US |
| 1979 | 5 391 320 000 $ US | 289 123 900 000 $ US |
| 1978 | - | 34 198 150 000 $ US |
| 1977 | - | 21 530 430 000 $ US |
| 1976 | - | 180 900 950 000 $ US |
| 1975 | - | 141 799 090 000 $ US |
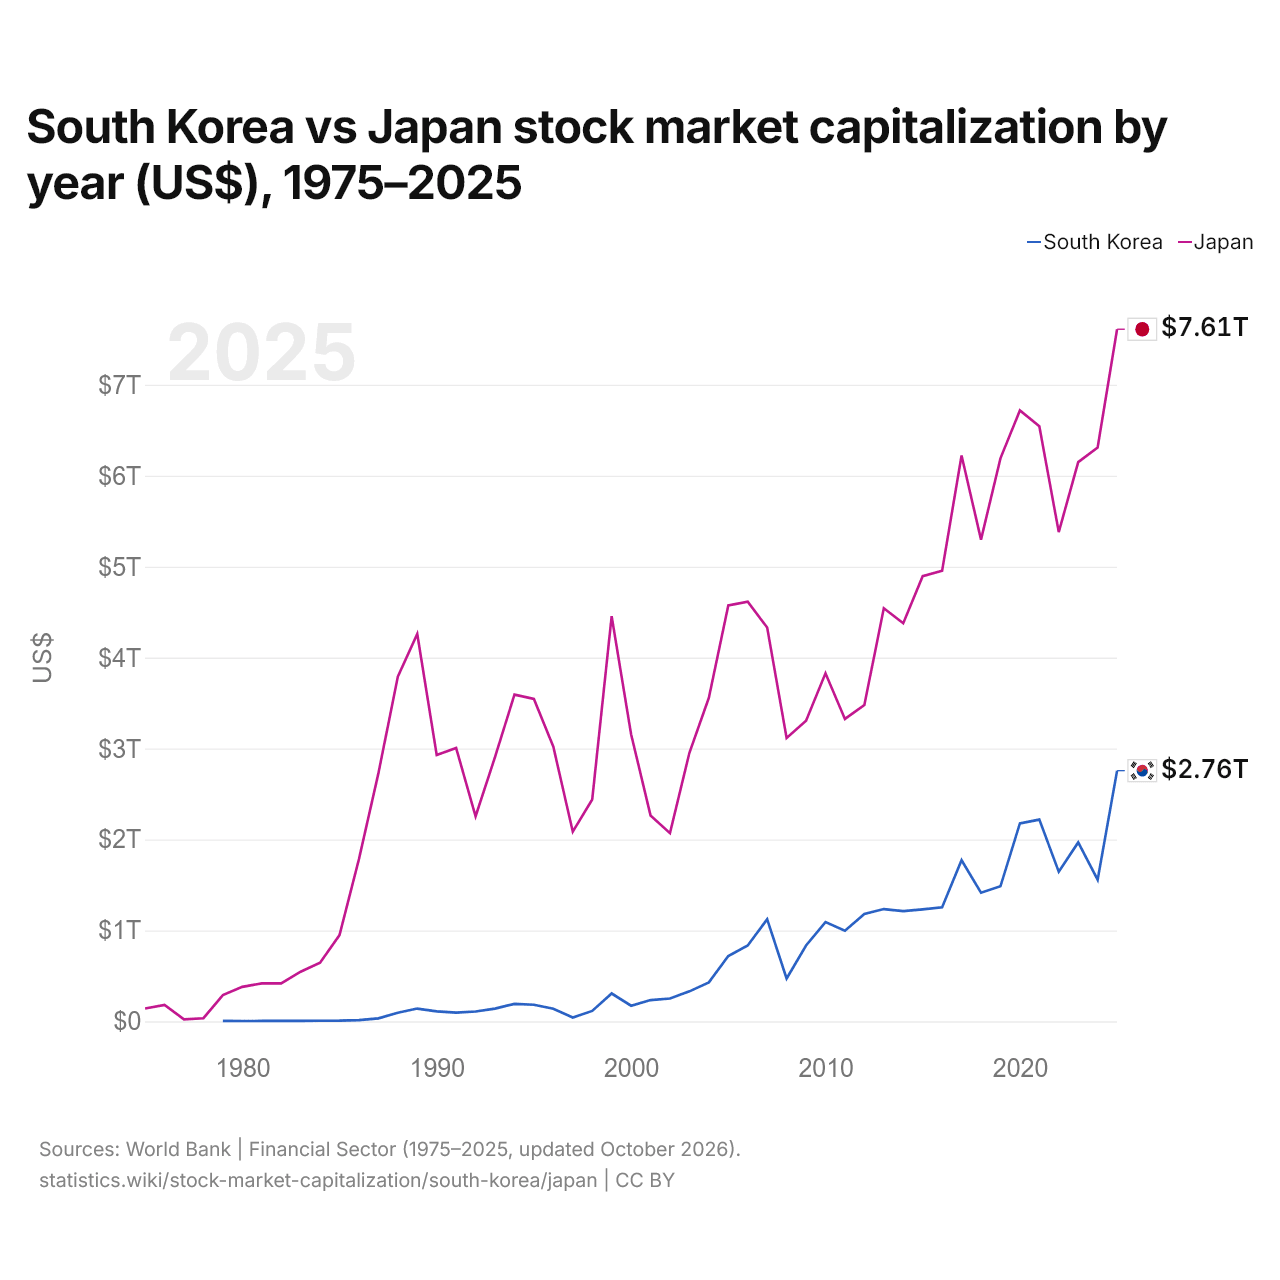
En 2025, les sociétés cotées valaient 2,76 billions de dollars en Corée du Sud et 7,61 billions de dollars au Japon : 2,8 fois plus au Japon. En 1979, les sociétés cotées valaient 54 fois plus au Japon : 5,39 milliards de dollars en Corée du Sud et 289 milliards de dollars au Japon.
La capitalisation boursière des sociétés nationales cotées au Japon est supérieure à celle des sociétés cotées en Corée du Sud chaque année depuis 1979.
Corée du Sud vs Japon : capitalisation boursière, % du PIB par année, 1975–2025
| Année | % du PIB | |
|---|---|---|
|
Corée du Sud
|
Japon
|
|
| 2025 | 147,2 % | 171,6 % |
| 2024 | 83 % | 150,6 % |
| 2023 | 106,7 % | 140,2 % |
| 2022 | 91,4 % | 121 % |
| 2021 | 114,2 % | 125,2 % |
| 2020 | 124,8 % | 129,5 % |
| 2019 | 84,8 % | 118 % |
| 2018 | 77,5 % | 102,8 % |
| 2017 | 103,6 % | 123,5 % |
| 2016 | 79,4 % | 97 % |
| 2015 | 80 % | 107,9 % |
| 2014 | 77,9 % | 87,8 % |
| 2013 | 86,1 % | 86,2 % |
| 2012 | 88,3 % | 54,9 % |
| 2011 | 76,2 % | 53 % |
| 2010 | 91,5 % | 65,9 % |
| 2009 | 84,9 % | 61,9 % |
| 2008 | 43,1 % | 60,4 % |
| 2007 | 91,9 % | 93,6 % |
| 2006 | 76,2 % | 99,3 % |
| 2005 | 73,9 % | 93,8 % |
| 2004 | 52 % | 72 % |
| 2003 | 45,2 % | 64,6 % |
| 2002 | 38,6 % | 48,7 % |
| 2001 | 41,2 % | 51 % |
| 2000 | 28,7 % | 62,6 % |
| 1999 | 59,4 % | 95 % |
| 1998 | 28,8 % | 58,8 % |
| 1997 | 7,1 % | 45,5 % |
| 1996 | 22 % | 60,1 % |
| 1995 | 31 % | 62,9 % |
| 1994 | 40 % | 70,4 % |
| 1993 | 34,4 % | 62,7 % |
| 1992 | 29,3 % | 55,5 % |
| 1991 | 28,3 % | 80,7 % |
| 1990 | 37,8 % | 90 % |
| 1989 | 55,3 % | 134,2 % |
| 1988 | 45,9 % | 118,7 % |
| 1987 | 21,7 % | 103,5 % |
| 1986 | 11,6 % | 82,4 % |
| 1985 | 7,1 % | 65,1 % |
| 1984 | 6,2 % | 46,9 % |
| 1983 | 4,9 % | 42,1 % |
| 1982 | 5,5 % | 35,3 % |
| 1981 | 5,7 % | 32,9 % |
| 1980 | 5,8 % | 32,9 % |
| 1979 | 7,9 % | 26,3 % |
| 1978 | - | 3,2 % |
| 1977 | - | 2,9 % |
| 1976 | - | 29,6 % |
| 1975 | - | 26,1 % |
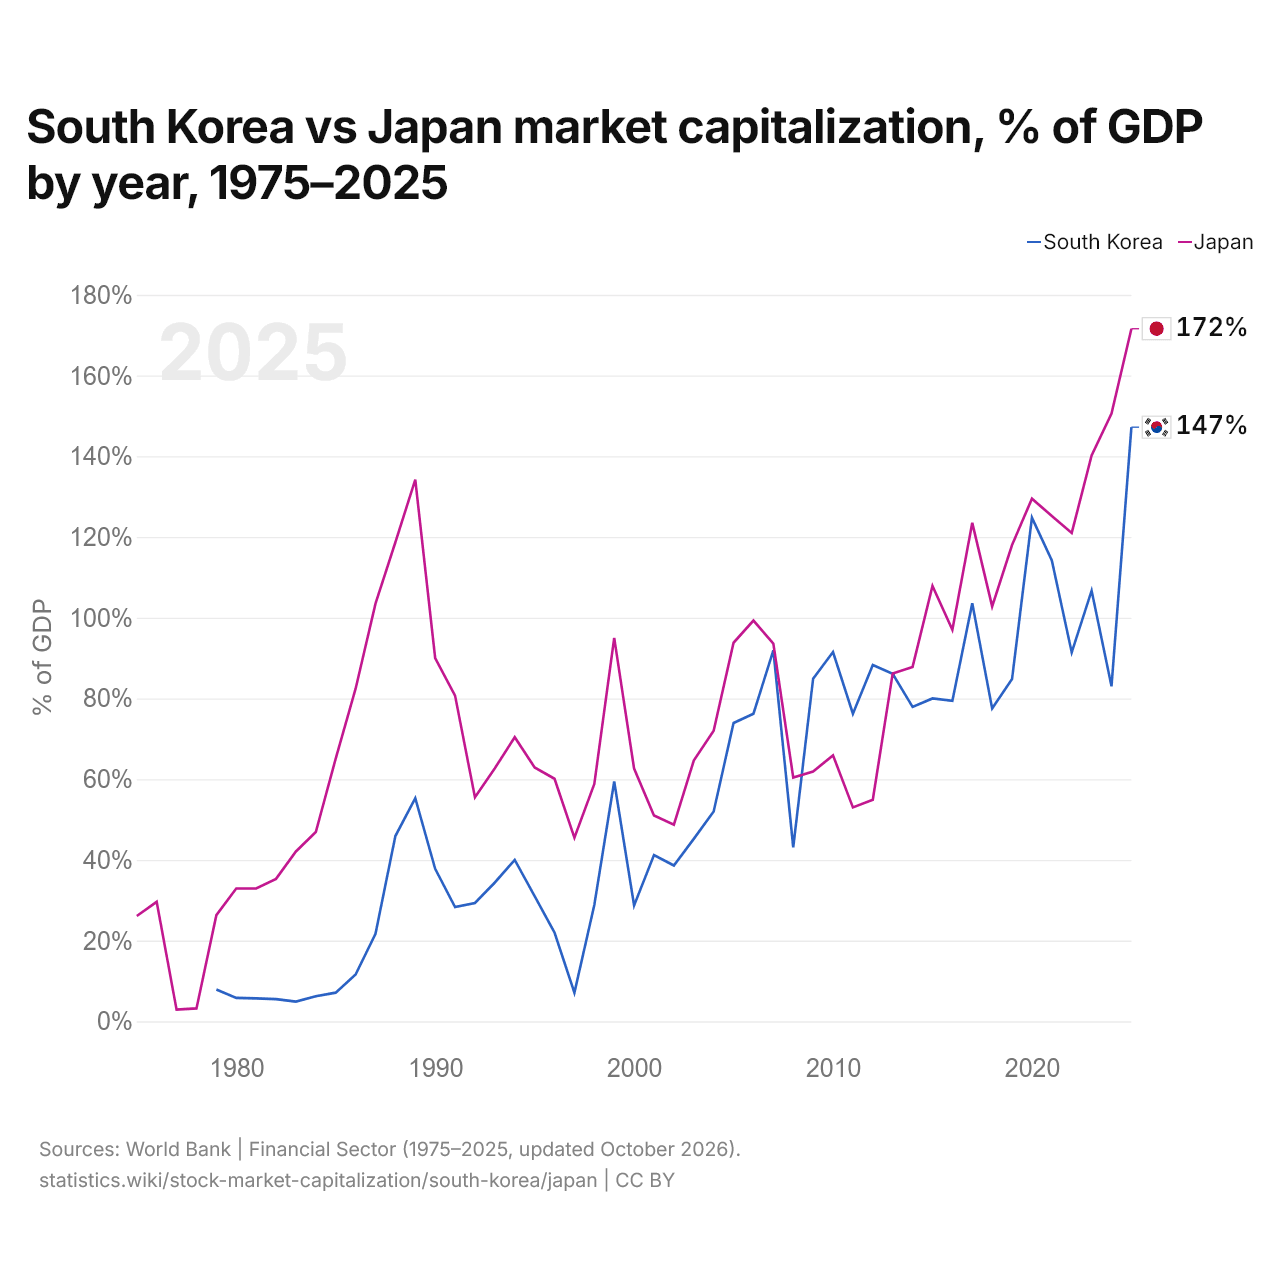
En 2025, la capitalisation boursière équivalait à 147,2 % du PIB en Corée du Sud et à 171,6 % au Japon : 24,4 points de pourcentage de plus au Japon. En 2015, les parts étaient de 80,0 % en Corée du Sud et de 107,9 % au Japon, soit 27,9 points de pourcentage de plus au Japon.
Corée du Sud vs Japon : dernière capitalisation boursière et sociétés cotées
|
Corée du Sud
|
Japon
|
|
|---|---|---|
| Capitalisation boursière | 2,76 Bn $US | 7,61 Bn $US |
| % du PIB | 147,2 % | 171,6 % |
| Sociétés nationales cotées | 2 653 | 3 942 |
| Rang mondial | 8/77 | 3/77 |
| Écart de capitalisation boursière | 0,36× | 2,8× |
Comparer la capitalisation boursière de 2 pays au choix
Sources :
- Banque mondiale | Secteur financier (1975–2025, mis à jour en octobre 2026)
Creative Commons Attribution (CC BY) : vous pouvez copier, partager, adapter et réutiliser ce contenu, y compris à des fins commerciales, à condition de citer statistics.wiki et d’indiquer les modifications apportées. Les sources citées ci-dessus peuvent avoir leurs propres conditions de licence.