
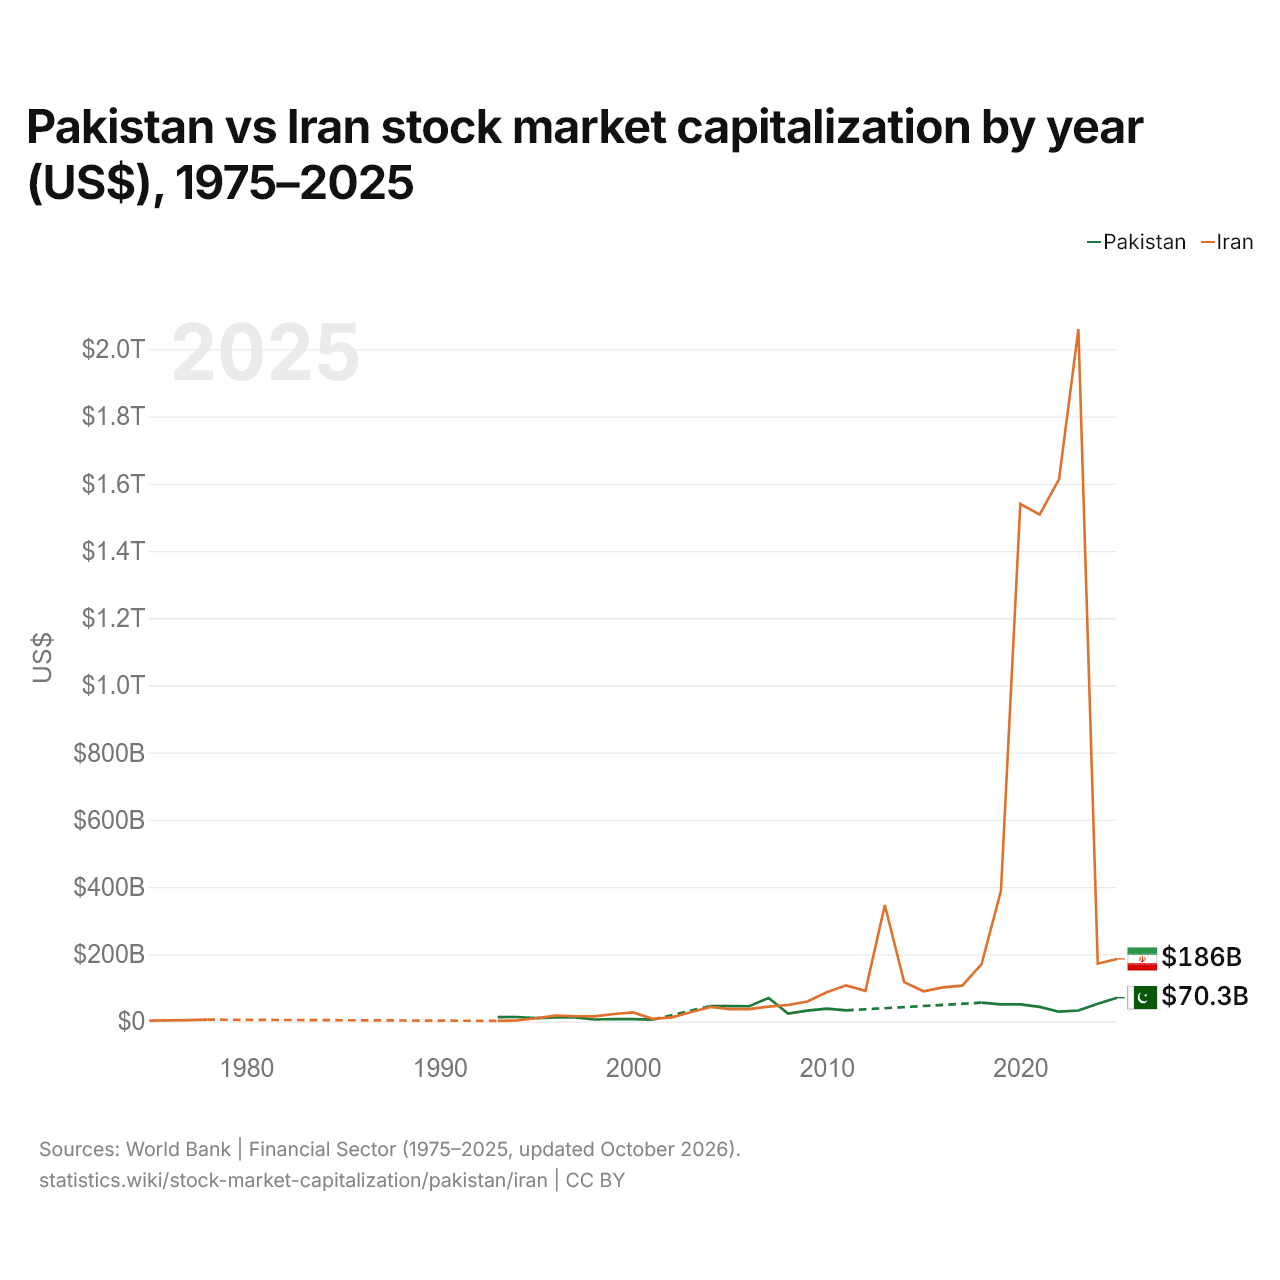
Pakistan vs Iran : capitalisation boursière par année ($ US), 1975–2025
| Année | $ US | |
|---|---|---|
 Pakistan |
 Iran |
|
| 2025 | 70 289 650 000 $ US | 185 635 780 000 $ US |
| 2024 | 52 073 620 000 $ US | 171 583 580 000 $ US |
| 2023 | 32 255 770 000 $ US | 2 059 638 860 000 $ US |
| 2022 | 28 713 900 000 $ US | 1 613 044 750 000 $ US |
| 2021 | 43 096 600 000 $ US | 1 508 229 410 000 $ US |
| 2020 | 50 278 510 000 $ US | 1 539 564 820 000 $ US |
| 2019 | 50 561 890 000 $ US | 388 666 940 000 $ US |
| 2018 | 55 503 510 000 $ US | 170 460 420 000 $ US |
| 2017 | - | 106 329 000 000 $ US |
| 2016 | - | 101 008 000 000 $ US |
| 2015 | - | 89 428 040 000 $ US |
| 2014 | - | 116 638 450 000 $ US |
| 2013 | - | 345 776 630 000 $ US |
| 2012 | - | 90 995 750 000 $ US |
| 2011 | 32 567 930 000 $ US | 107 089 650 000 $ US |
| 2010 | 38 007 180 000 $ US | 86 641 520 000 $ US |
| 2009 | 31 886 980 000 $ US | 59 183 540 000 $ US |
| 2008 | 23 354 040 000 $ US | 48 712 710 000 $ US |
| 2007 | 69 715 390 000 $ US | 43 885 010 000 $ US |
| 2006 | 44 906 480 000 $ US | 36 314 580 000 $ US |
| 2005 | 45 317 280 000 $ US | 36 440 220 000 $ US |
| 2004 | 45 595 630 000 $ US | 42 600 420 000 $ US |
| 2003 | - | 27 544 170 000 $ US |
| 2002 | - | 11 760 560 000 $ US |
| 2001 | 4 903 400 000 $ US | 7 381 240 000 $ US |
| 2000 | 6 624 600 000 $ US | 26 685 660 000 $ US |
| 1999 | 7 007 800 000 $ US | 21 827 030 000 $ US |
| 1998 | 5 418 610 000 $ US | 14 903 260 000 $ US |
| 1997 | 11 805 320 000 $ US | 15 181 250 000 $ US |
| 1996 | 11 660 460 000 $ US | 17 024 440 000 $ US |
| 1995 | 9 459 210 000 $ US | 9 161 700 000 $ US |
| 1994 | 12 927 800 000 $ US | 2 803 000 000 $ US |
| 1993 | 12 651 700 000 $ US | 1 286 800 000 $ US |
| 1992 | - | - |
| 1991 | - | - |
| 1990 | - | - |
| 1989 | - | - |
| 1988 | - | - |
| 1987 | - | - |
| 1986 | - | - |
| 1985 | - | - |
| 1984 | - | - |
| 1983 | - | - |
| 1982 | - | - |
| 1981 | - | - |
| 1980 | - | - |
| 1979 | - | - |
| 1978 | - | 5 001 760 000 $ US |
| 1977 | - | 3 814 710 000 $ US |
| 1976 | - | 3 100 000 000 $ US |
| 1975 | - | 1 900 010 000 $ US |
En 2025, les sociétés cotées valaient 70,3 milliards de dollars au Pakistan et 186 milliards de dollars en Iran : 2,6 fois plus en Iran. En 1993, les sociétés cotées valaient 9,8 fois plus au Pakistan : 12,7 milliards de dollars au Pakistan et 1,29 milliard de dollars en Iran.
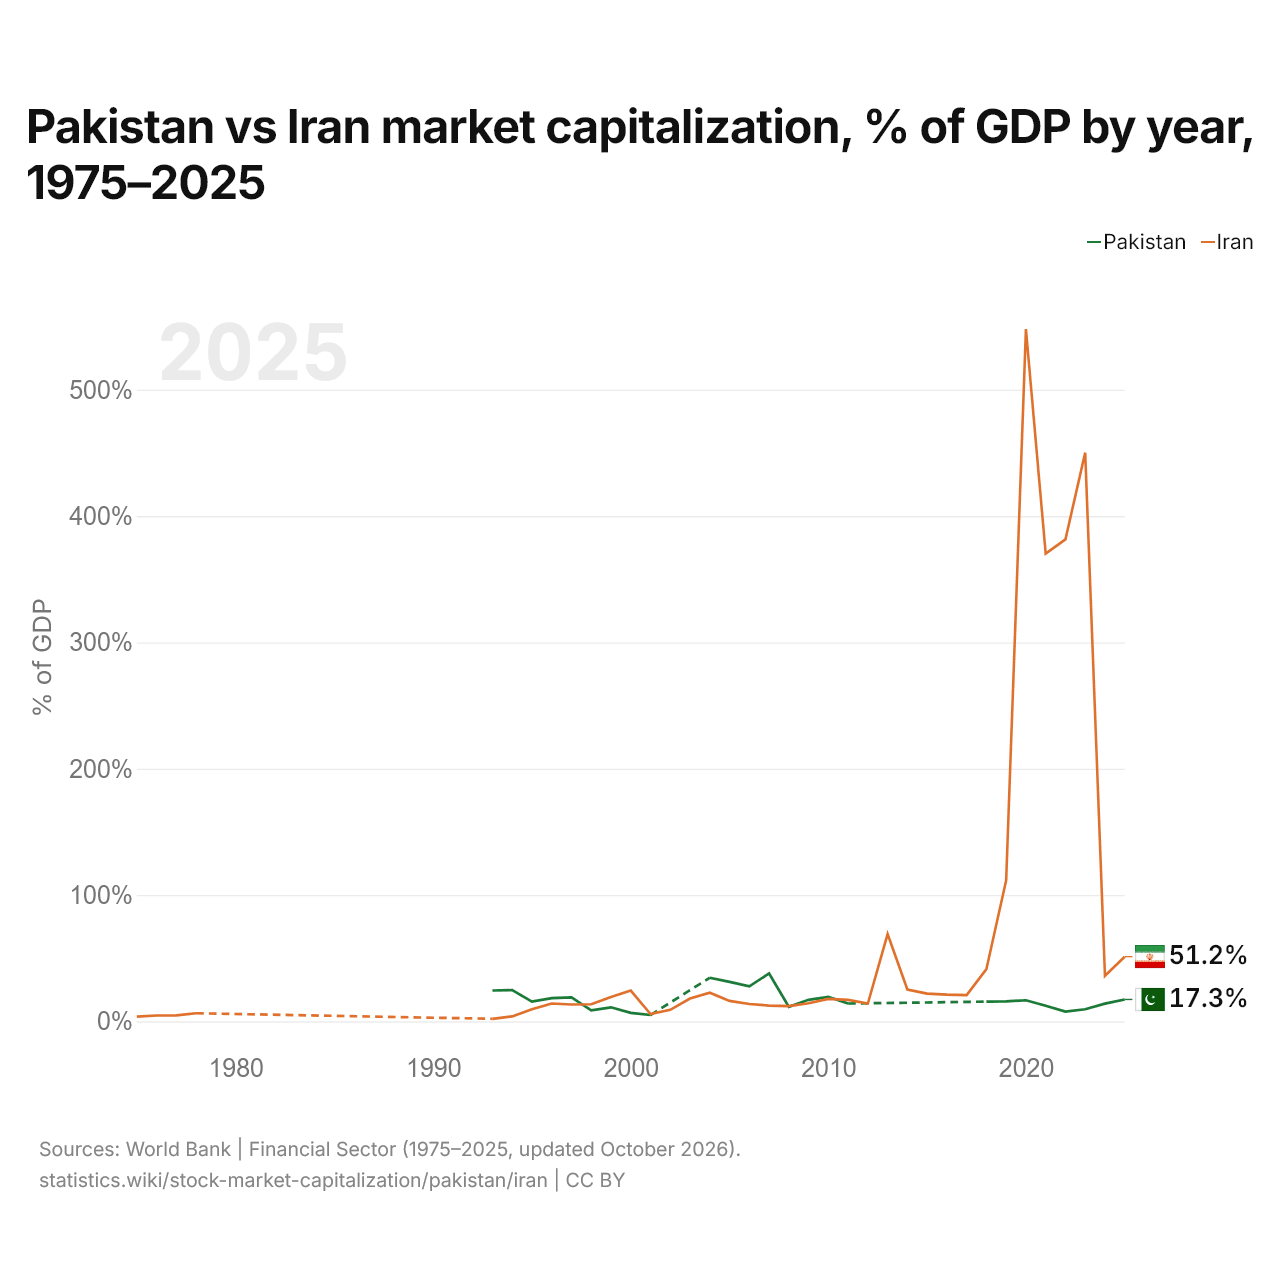
Pakistan vs Iran : capitalisation boursière, % du PIB par année, 1975–2025
| Année | % du PIB | |
|---|---|---|
|
Pakistan
|
Iran
|
|
| 2025 | 17,3 % | 51,2 % |
| 2024 | 14 % | 36,1 % |
| 2023 | 9,6 % | 450,2 % |
| 2022 | 7,7 % | 381,6 % |
| 2021 | 12,4 % | 370,3 % |
| 2020 | 16,7 % | 548 % |
| 2019 | 15,8 % | 111,7 % |
| 2018 | 15,6 % | 41,4 % |
| 2017 | - | 20,8 % |
| 2016 | - | 21,1 % |
| 2015 | - | 21,9 % |
| 2014 | - | 25,2 % |
| 2013 | - | 69,1 % |
| 2012 | - | 14,1 % |
| 2011 | 14,1 % | 17 % |
| 2010 | 19,3 % | 17,8 % |
| 2009 | 17 % | 14,3 % |
| 2008 | 11,5 % | 12 % |
| 2007 | 37,9 % | 12,5 % |
| 2006 | 27,7 % | 13,7 % |
| 2005 | 31,2 % | 16,2 % |
| 2004 | 34,5 % | 22,7 % |
| 2003 | - | 18,1 % |
| 2002 | - | 9,1 % |
| 2001 | 5 % | 5,8 % |
| 2000 | 6,7 % | 24,4 % |
| 1999 | 11,1 % | 19,2 % |
| 1998 | 8,7 % | 13,5 % |
| 1997 | 18,9 % | 13,3 % |
| 1996 | 18,4 % | 14,1 % |
| 1995 | 15,6 % | 9,5 % |
| 1994 | 24,7 % | 3,9 % |
| 1993 | 24,4 % | 2 % |
| 1992 | - | - |
| 1991 | - | - |
| 1990 | - | - |
| 1989 | - | - |
| 1988 | - | - |
| 1987 | - | - |
| 1986 | - | - |
| 1985 | - | - |
| 1984 | - | - |
| 1983 | - | - |
| 1982 | - | - |
| 1981 | - | - |
| 1980 | - | - |
| 1979 | - | - |
| 1978 | - | 6,4 % |
| 1977 | - | 4,7 % |
| 1976 | - | 4,6 % |
| 1975 | - | 3,7 % |
En 2025, la capitalisation boursière équivalait à 17,3 % du PIB au Pakistan et à 51,2 % en Iran : 33,9 points de pourcentage de plus en Iran.
Pakistan vs Iran : dernière capitalisation boursière et sociétés cotées
|
Pakistan
|
Iran
|
|
|---|---|---|
| Capitalisation boursière | 70,3 Md $US | 186 Md $US |
| % du PIB | 17,3 % | 51,2 % |
| Sociétés nationales cotées | 535 | 630 |
| Rang mondial | 40/77 | 29/77 |
| Écart de capitalisation boursière | 0,38× | 2,6× |
Comparer la capitalisation boursière de 2 pays au choix
Sources :
- Banque mondiale | Secteur financier (1975–2025, mis à jour en octobre 2026)
Creative Commons Attribution (CC BY) : vous pouvez copier, partager, adapter et réutiliser ce contenu, y compris à des fins commerciales, à condition de citer statistics.wiki et d’indiquer les modifications apportées. Les sources citées ci-dessus peuvent avoir leurs propres conditions de licence.