
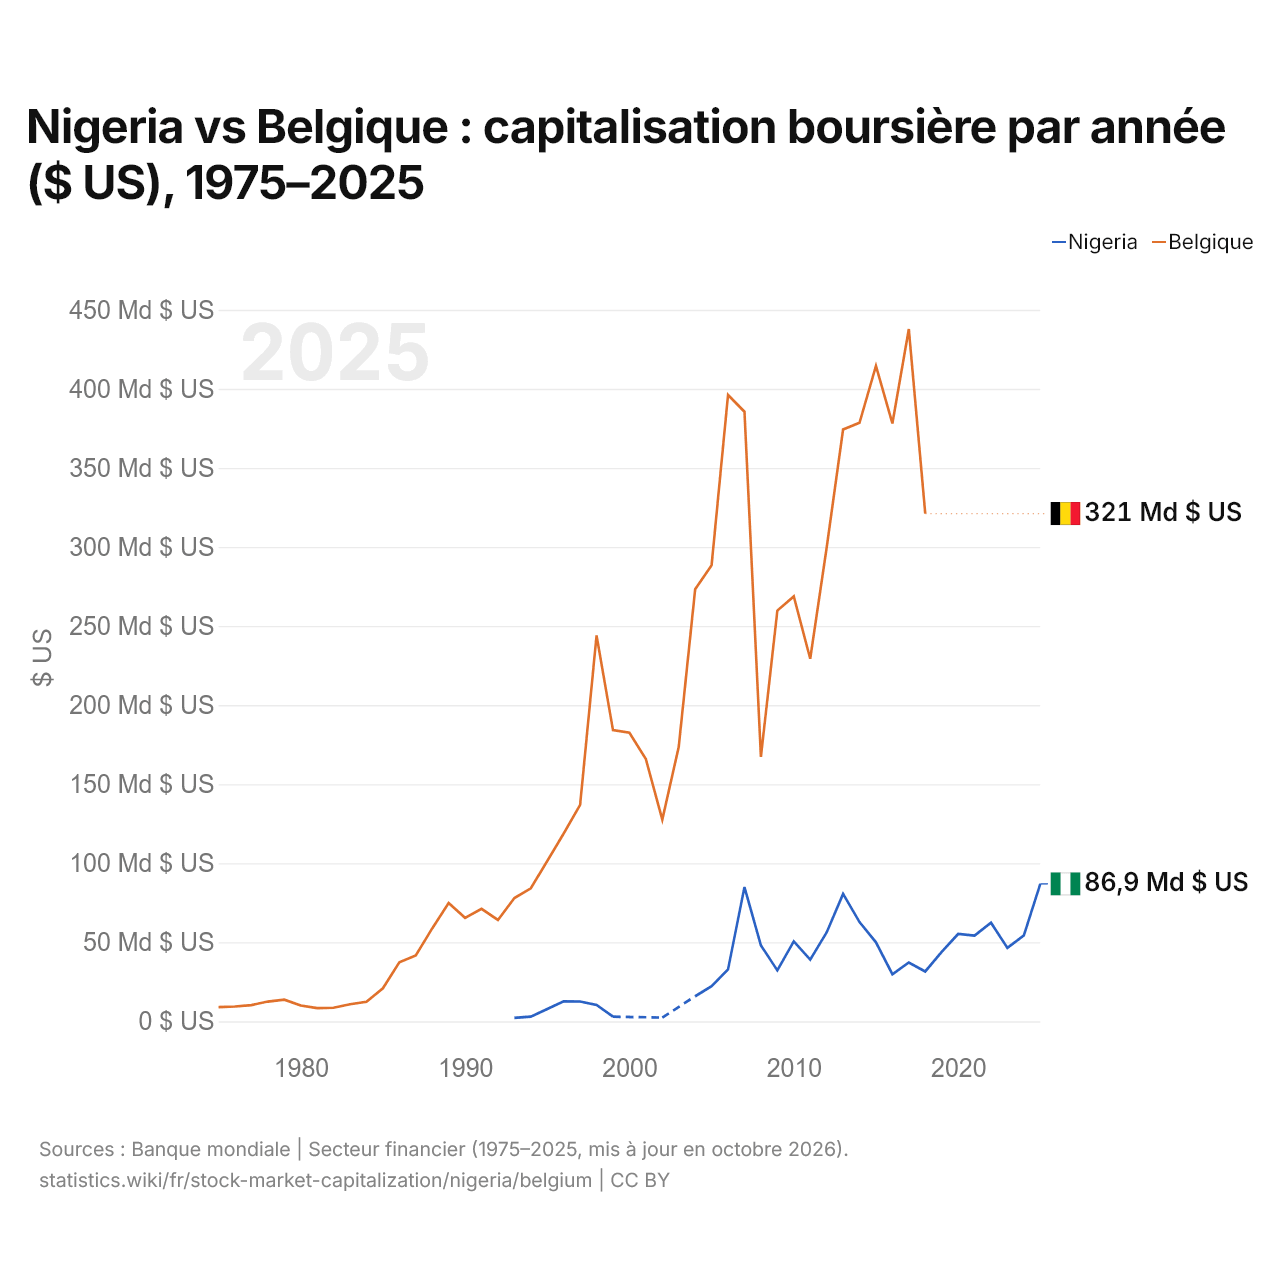
Nigeria vs Belgique : capitalisation boursière par année ($ US), 1975–2025
| Année | $ US | |
|---|---|---|
 Nigeria |
 Belgique |
|
| 2025 | 86 942 760 000 $ US | - |
| 2024 | 54 400 940 000 $ US | - |
| 2023 | 46 449 580 000 $ US | - |
| 2022 | 62 380 710 000 $ US | - |
| 2021 | 54 230 600 000 $ US | - |
| 2020 | 55 244 140 000 $ US | - |
| 2019 | 43 921 600 000 $ US | - |
| 2018 | 31 520 550 000 $ US | 321 093 542 984 $ US |
| 2017 | 37 217 620 000 $ US | 437 793 522 325 $ US |
| 2016 | 29 792 434 000 $ US | 378 144 283 251 $ US |
| 2015 | 49 973 880 000 $ US | 414 556 380 000 $ US |
| 2014 | 62 766 310 000 $ US | 378 525 790 000 $ US |
| 2013 | 80 609 900 000 $ US | 374 325 590 000 $ US |
| 2012 | 56 205 200 000 $ US | 299 517 140 000 $ US |
| 2011 | 39 028 390 000 $ US | 229 320 850 000 $ US |
| 2010 | 50 546 400 000 $ US | 268 726 290 000 $ US |
| 2009 | 32 223 400 000 $ US | 259 768 580 000 $ US |
| 2008 | 48 062 280 000 $ US | 167 218 340 000 $ US |
| 2007 | 84 894 570 000 $ US | 385 552 940 000 $ US |
| 2006 | 32 830 510 000 $ US | 396 167 930 000 $ US |
| 2005 | 22 244 000 000 $ US | 288 481 060 000 $ US |
| 2004 | 15 865 940 000 $ US | 273 247 420 000 $ US |
| 2003 | - | 173 552 620 000 $ US |
| 2002 | 2 373 940 000 $ US | 127 556 560 000 $ US |
| 2001 | - | 165 843 000 000 $ US |
| 2000 | - | 182 480 520 000 $ US |
| 1999 | 2 939 580 000 $ US | 184 135 510 000 $ US |
| 1998 | 10 321 670 000 $ US | 244 037 800 000 $ US |
| 1997 | 12 559 050 000 $ US | 136 934 280 000 $ US |
| 1996 | 12 714 500 000 $ US | 118 801 970 000 $ US |
| 1995 | 7 777 200 000 $ US | 101 422 290 000 $ US |
| 1994 | 2 977 300 000 $ US | 84 124 970 000 $ US |
| 1993 | 2 142 500 000 $ US | 77 975 730 000 $ US |
| 1992 | - | 64 104 900 000 $ US |
| 1991 | - | 71 113 600 000 $ US |
| 1990 | - | 65 449 090 000 $ US |
| 1989 | - | 74 876 060 000 $ US |
| 1988 | - | 58 786 050 000 $ US |
| 1987 | - | 41 648 090 000 $ US |
| 1986 | - | 37 336 820 000 $ US |
| 1985 | - | 20 871 330 000 $ US |
| 1984 | - | 12 342 040 000 $ US |
| 1983 | - | 10 779 010 000 $ US |
| 1982 | - | 8 565 170 000 $ US |
| 1981 | - | 8 369 180 000 $ US |
| 1980 | - | 10 033 090 000 $ US |
| 1979 | - | 13 734 380 000 $ US |
| 1978 | - | 12 507 160 000 $ US |
| 1977 | - | 10 291 330 000 $ US |
| 1976 | - | 9 400 050 000 $ US |
| 1975 | - | 9 000 100 000 $ US |
Les sociétés cotées valent 86,9 milliards de dollars au Nigeria (2025), et 321 milliards de dollars en Belgique (2018). En 1993, les sociétés cotées valaient 36 fois plus en Belgique : 2,14 milliards de dollars au Nigeria et 78 milliards de dollars en Belgique.
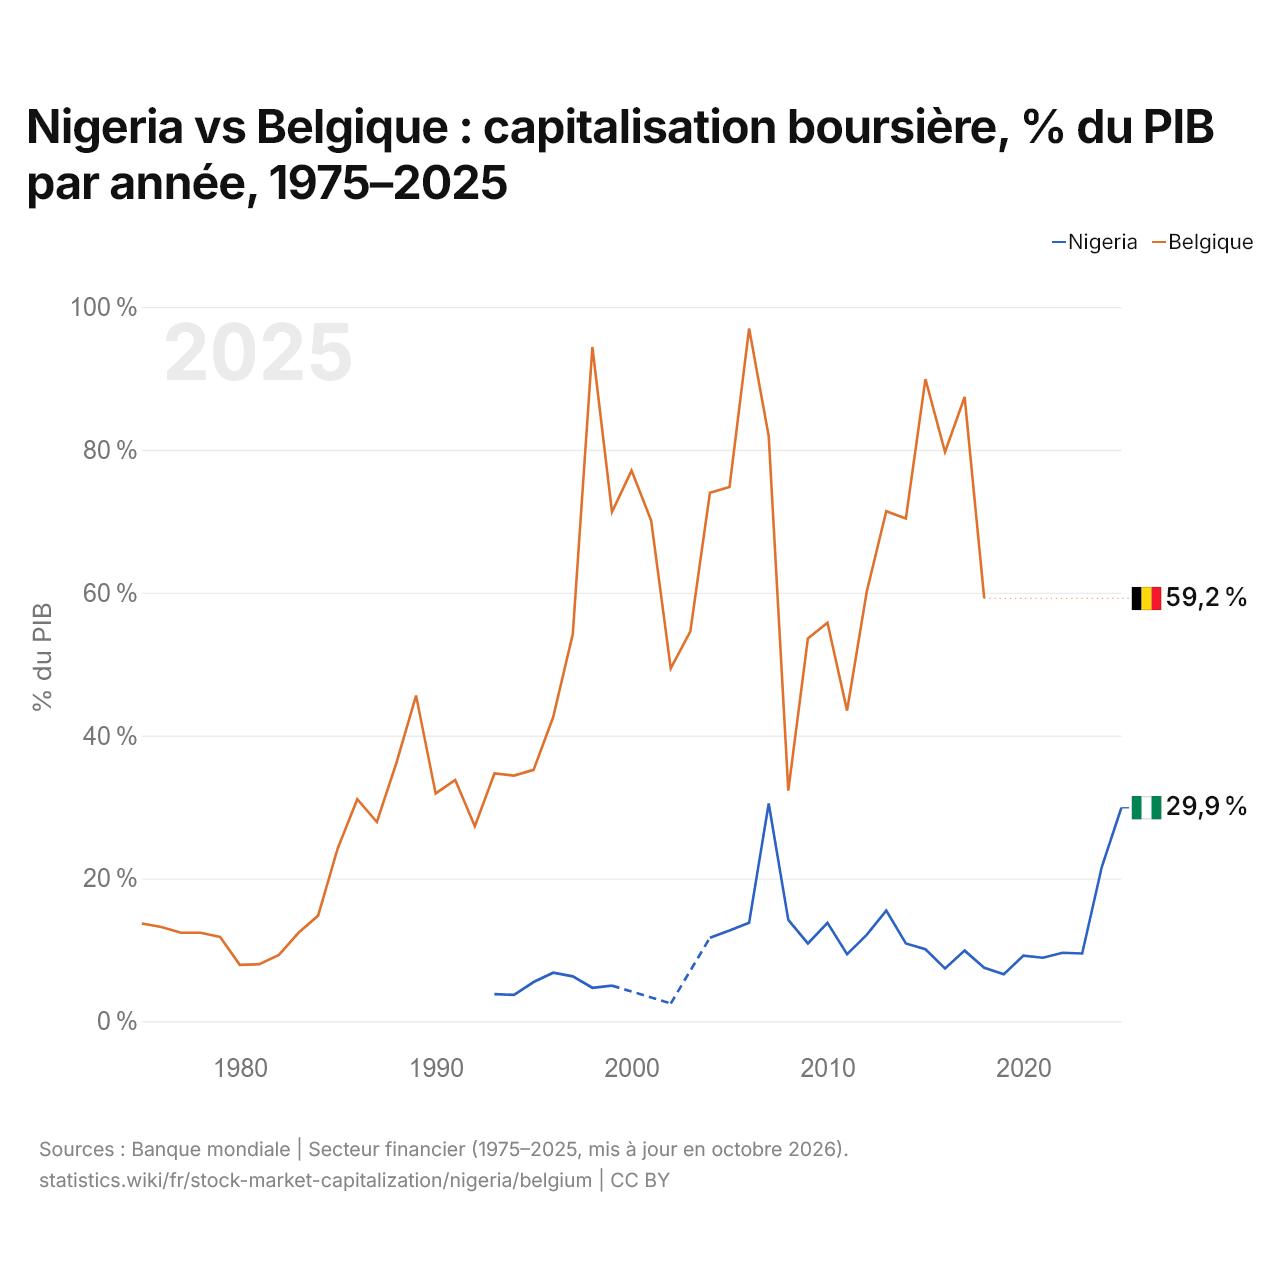
Nigeria vs Belgique : capitalisation boursière, % du PIB par année, 1975–2025
| Année | % du PIB | |
|---|---|---|
|
Nigeria
|
Belgique
|
|
| 2025 | 29,9 % | - |
| 2024 | 21,6 % | - |
| 2023 | 9,5 % | - |
| 2022 | 9,6 % | - |
| 2021 | 8,9 % | - |
| 2020 | 9,2 % | - |
| 2019 | 6,6 % | - |
| 2018 | 7,5 % | 59,2 % |
| 2017 | 9,9 % | 87,4 % |
| 2016 | 7,4 % | 79,7 % |
| 2015 | 10,1 % | 89,9 % |
| 2014 | 10,9 % | 70,4 % |
| 2013 | 15,5 % | 71,4 % |
| 2012 | 12,1 % | 60,1 % |
| 2011 | 9,4 % | 43,5 % |
| 2010 | 13,8 % | 55,8 % |
| 2009 | 10,9 % | 53,6 % |
| 2008 | 14,2 % | 32,3 % |
| 2007 | 30,5 % | 81,9 % |
| 2006 | 13,8 % | 97 % |
| 2005 | 12,7 % | 74,8 % |
| 2004 | 11,7 % | 74 % |
| 2003 | - | 54,6 % |
| 2002 | 2,5 % | 49,4 % |
| 2001 | - | 70,1 % |
| 2000 | - | 77,1 % |
| 1999 | 5 % | 71,3 % |
| 1998 | 4,7 % | 94,4 % |
| 1997 | 6,3 % | 54,2 % |
| 1996 | 6,8 % | 42,6 % |
| 1995 | 5,5 % | 35,2 % |
| 1994 | 3,7 % | 34,4 % |
| 1993 | 3,8 % | 34,7 % |
| 1992 | - | 27,3 % |
| 1991 | - | 33,8 % |
| 1990 | - | 31,9 % |
| 1989 | - | 45,6 % |
| 1988 | - | 36,2 % |
| 1987 | - | 27,9 % |
| 1986 | - | 31,1 % |
| 1985 | - | 24,2 % |
| 1984 | - | 14,8 % |
| 1983 | - | 12,4 % |
| 1982 | - | 9,3 % |
| 1981 | - | 8 % |
| 1980 | - | 7,9 % |
| 1979 | - | 11,8 % |
| 1978 | - | 12,4 % |
| 1977 | - | 12,4 % |
| 1976 | - | 13,2 % |
| 1975 | - | 13,7 % |
La capitalisation boursière équivaut à 29,9 % du PIB au Nigeria (2025), et à 59,2 % en Belgique (2018). En 2008, les parts étaient de 14,2 % au Nigeria et de 32,3 % en Belgique, soit 18,1 points de pourcentage de plus en Belgique.
Nigeria vs Belgique : dernière capitalisation boursière et sociétés cotées
|
Nigeria
|
Belgique
|
|
|---|---|---|
| Capitalisation boursière | 86,9 Md $US (2025) | 321 Md $US (2018) |
| % du PIB | 29,9 % (2025) | 59,2 % (2018) |
| Sociétés nationales cotées | 165 (2025) | 117 (2015) |
| Rang mondial | 38/77 | Non classé |
Comparer la capitalisation boursière de 2 pays au choix
Sources :
- Banque mondiale | Secteur financier (1975–2025, mis à jour en octobre 2026)
Creative Commons Attribution (CC BY) : vous pouvez copier, partager, adapter et réutiliser ce contenu, y compris à des fins commerciales, à condition de citer statistics.wiki et d’indiquer les modifications apportées. Les sources citées ci-dessus peuvent avoir leurs propres conditions de licence.