
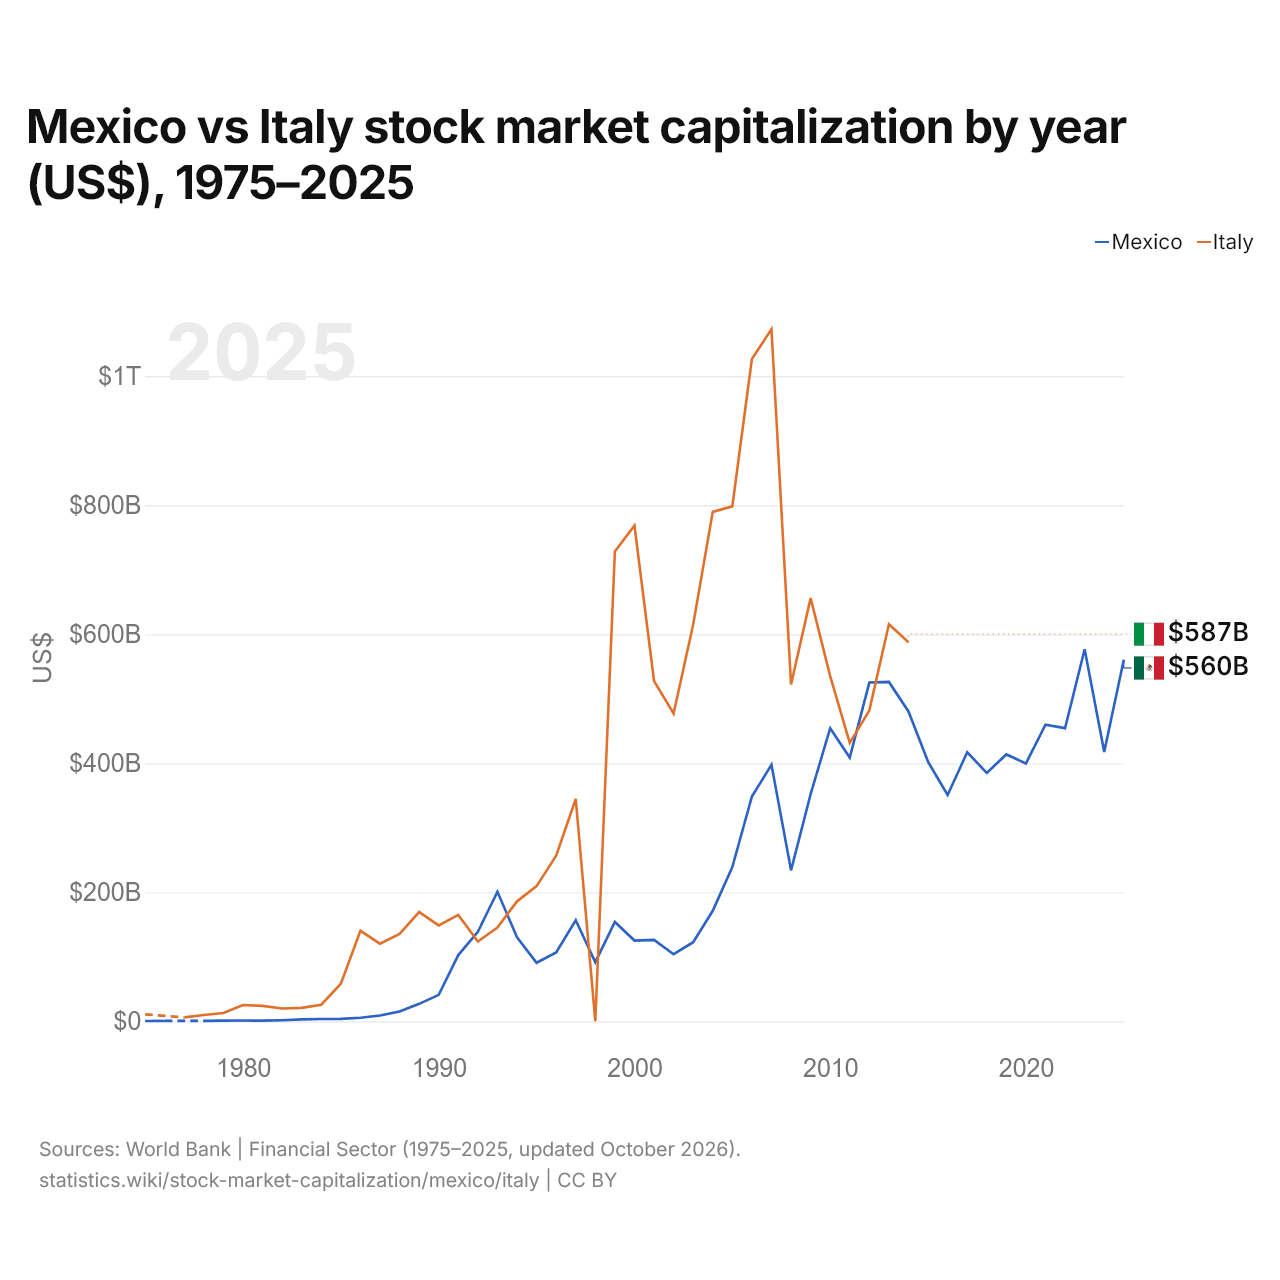
Mexique vs Italie : capitalisation boursière par année ($ US), 1975–2025
| Année | $ US | |
|---|---|---|
 Mexique |
 Italie |
|
| 2025 | 560 407 290 000 $ US | - |
| 2024 | 417 606 000 000 $ US | - |
| 2023 | 576 666 230 000 $ US | - |
| 2022 | 454 370 430 000 $ US | - |
| 2021 | 459 707 620 000 $ US | - |
| 2020 | 399 616 700 000 $ US | - |
| 2019 | 413 618 820 000 $ US | - |
| 2018 | 385 051 430 000 $ US | - |
| 2017 | 417 020 520 000 $ US | - |
| 2016 | 350 809 553 624 $ US | - |
| 2015 | 402 253 280 000 $ US | - |
| 2014 | 480 245 320 000 $ US | 587 312 440 000 $ US |
| 2013 | 526 015 640 000 $ US | 615 462 310 000 $ US |
| 2012 | 525 056 680 000 $ US | 481 827 290 000 $ US |
| 2011 | 408 689 830 000 $ US | 431 486 430 000 $ US |
| 2010 | 454 345 220 000 $ US | 535 058 930 000 $ US |
| 2009 | 352 045 440 000 $ US | 655 848 250 000 $ US |
| 2008 | 234 054 920 000 $ US | 522 087 790 000 $ US |
| 2007 | 397 724 640 000 $ US | 1 072 534 680 000 $ US |
| 2006 | 348 345 130 000 $ US | 1 026 504 210 000 $ US |
| 2005 | 239 127 950 000 $ US | 798 072 870 000 $ US |
| 2004 | 171 401 990 000 $ US | 789 562 620 000 $ US |
| 2003 | 122 532 960 000 $ US | 614 841 570 000 $ US |
| 2002 | 103 941 150 000 $ US | 477 075 420 000 $ US |
| 2001 | 126 258 380 000 $ US | 527 467 280 000 $ US |
| 2000 | 125 203 830 000 $ US | 768 363 350 000 $ US |
| 1999 | 154 043 880 000 $ US | 728 240 350 000 $ US |
| 1998 | 91 745 800 000 $ US | 294 240 000 $ US |
| 1997 | 156 595 010 000 $ US | 344 664 970 000 $ US |
| 1996 | 106 770 460 000 $ US | 256 595 340 000 $ US |
| 1995 | 90 693 960 000 $ US | 209 522 520 000 $ US |
| 1994 | 130 245 850 000 $ US | 185 970 720 000 $ US |
| 1993 | 200 865 240 000 $ US | 145 299 650 000 $ US |
| 1992 | 138 744 000 000 $ US | 123 659 400 000 $ US |
| 1991 | 102 760 000 000 $ US | 165 032 960 000 $ US |
| 1990 | 41 050 000 000 $ US | 148 765 530 000 $ US |
| 1989 | 27 080 000 000 $ US | 169 416 770 000 $ US |
| 1988 | 15 200 000 000 $ US | 135 416 600 000 $ US |
| 1987 | 9 050 000 000 $ US | 120 346 570 000 $ US |
| 1986 | 5 520 000 000 $ US | 140 241 420 000 $ US |
| 1985 | 3 910 000 000 $ US | 58 166 830 000 $ US |
| 1984 | 3 660 000 000 $ US | 25 721 330 000 $ US |
| 1983 | 3 030 000 000 $ US | 20 908 910 000 $ US |
| 1982 | 1 720 000 000 $ US | 19 926 410 000 $ US |
| 1981 | 1 010 000 000 $ US | 23 957 300 000 $ US |
| 1980 | 1 299 000 000 $ US | 25 340 150 000 $ US |
| 1979 | 1 197 000 000 $ US | 12 859 570 000 $ US |
| 1978 | 738 000 000 $ US | 9 806 640 000 $ US |
| 1977 | - | 6 165 910 000 $ US |
| 1976 | 800 000 000 $ US | - |
| 1975 | 470 000 000 $ US | 10 800 000 000 $ US |
Les sociétés cotées valent 560 milliards de dollars au Mexique (2025), et 587 milliards de dollars en Italie (2014). En 1975, les sociétés cotées valaient 23 fois plus en Italie : 470 millions de dollars au Mexique et 10,8 milliards de dollars en Italie.
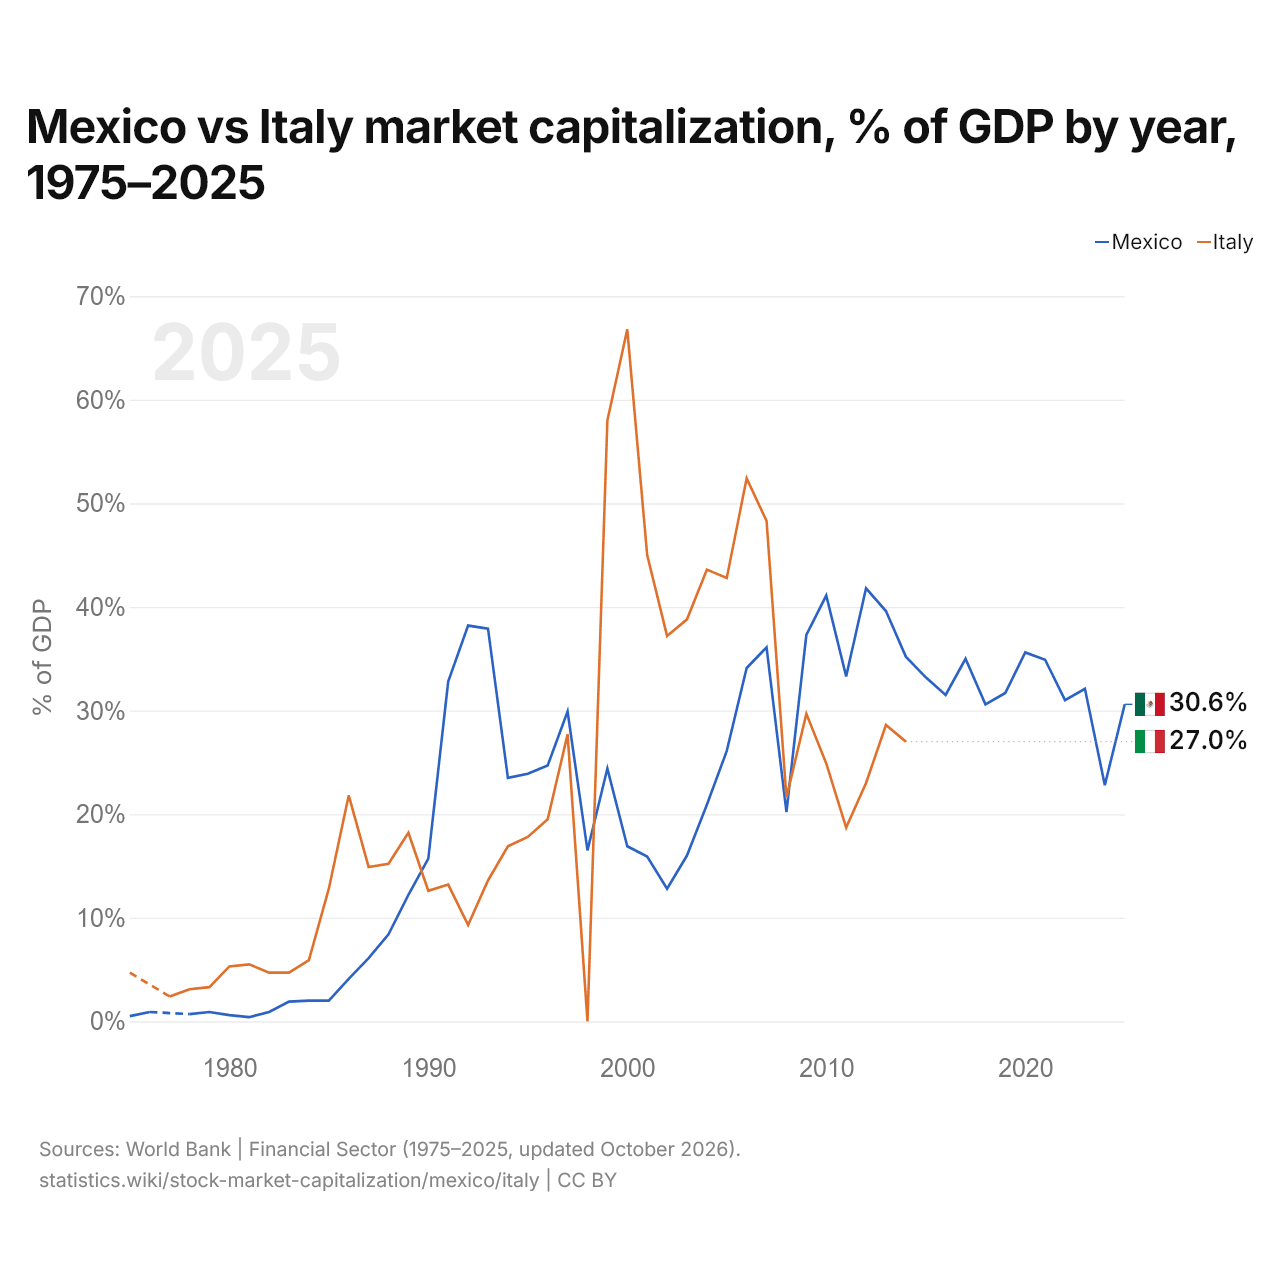
Mexique vs Italie : capitalisation boursière, % du PIB par année, 1975–2025
| Année | % du PIB | |
|---|---|---|
|
Mexique
|
Italie
|
|
| 2025 | 30,6 % | - |
| 2024 | 22,8 % | - |
| 2023 | 32,1 % | - |
| 2022 | 31 % | - |
| 2021 | 34,9 % | - |
| 2020 | 35,6 % | - |
| 2019 | 31,7 % | - |
| 2018 | 30,6 % | - |
| 2017 | 35 % | - |
| 2016 | 31,5 % | - |
| 2015 | 33,2 % | - |
| 2014 | 35,2 % | 27 % |
| 2013 | 39,6 % | 28,6 % |
| 2012 | 41,8 % | 23 % |
| 2011 | 33,3 % | 18,7 % |
| 2010 | 41,1 % | 24,9 % |
| 2009 | 37,3 % | 29,7 % |
| 2008 | 20,2 % | 21,6 % |
| 2007 | 36,1 % | 48,3 % |
| 2006 | 34,1 % | 52,4 % |
| 2005 | 26,1 % | 42,8 % |
| 2004 | 20,9 % | 43,6 % |
| 2003 | 16 % | 38,8 % |
| 2002 | 12,8 % | 37,2 % |
| 2001 | 15,9 % | 45 % |
| 2000 | 16,9 % | 66,8 % |
| 1999 | 24,4 % | 58 % |
| 1998 | 16,5 % | 0 % |
| 1997 | 29,9 % | 27,7 % |
| 1996 | 24,7 % | 19,5 % |
| 1995 | 23,9 % | 17,8 % |
| 1994 | 23,5 % | 16,9 % |
| 1993 | 37,9 % | 13,6 % |
| 1992 | 38,2 % | 9,3 % |
| 1991 | 32,8 % | 13,2 % |
| 1990 | 15,7 % | 12,6 % |
| 1989 | 12,2 % | 18,2 % |
| 1988 | 8,4 % | 15,2 % |
| 1987 | 6,1 % | 14,9 % |
| 1986 | 4,1 % | 21,8 % |
| 1985 | 2 % | 12,8 % |
| 1984 | 2 % | 5,9 % |
| 1983 | 1,9 % | 4,7 % |
| 1982 | 0,9 % | 4,7 % |
| 1981 | 0,4 % | 5,5 % |
| 1980 | 0,6 % | 5,3 % |
| 1979 | 0,9 % | 3,3 % |
| 1978 | 0,7 % | 3,1 % |
| 1977 | - | 2,4 % |
| 1976 | 0,9 % | - |
| 1975 | 0,5 % | 4,7 % |
La capitalisation boursière équivaut à 30,6 % du PIB au Mexique (2025), et à 27,0 % en Italie (2014). En 2004, les parts étaient de 20,9 % au Mexique et de 43,6 % en Italie, soit 22,7 points de pourcentage de plus en Italie.
Mexique vs Italie : dernière capitalisation boursière et sociétés cotées
|
Mexique
|
Italie
|
|
|---|---|---|
| Capitalisation boursière | 560 Md $US (2025) | 587 Md $US (2014) |
| % du PIB | 30,6 % (2025) | 27,0 % (2014) |
| Sociétés nationales cotées | 129 (2024) | 290 (2014) |
| Rang mondial | 19/77 | Non classé |
Comparer la capitalisation boursière de 2 pays au choix
Sources :
- Banque mondiale | Secteur financier (1975–2025, mis à jour en octobre 2026)
Creative Commons Attribution (CC BY) : vous pouvez copier, partager, adapter et réutiliser ce contenu, y compris à des fins commerciales, à condition de citer statistics.wiki et d’indiquer les modifications apportées. Les sources citées ci-dessus peuvent avoir leurs propres conditions de licence.