
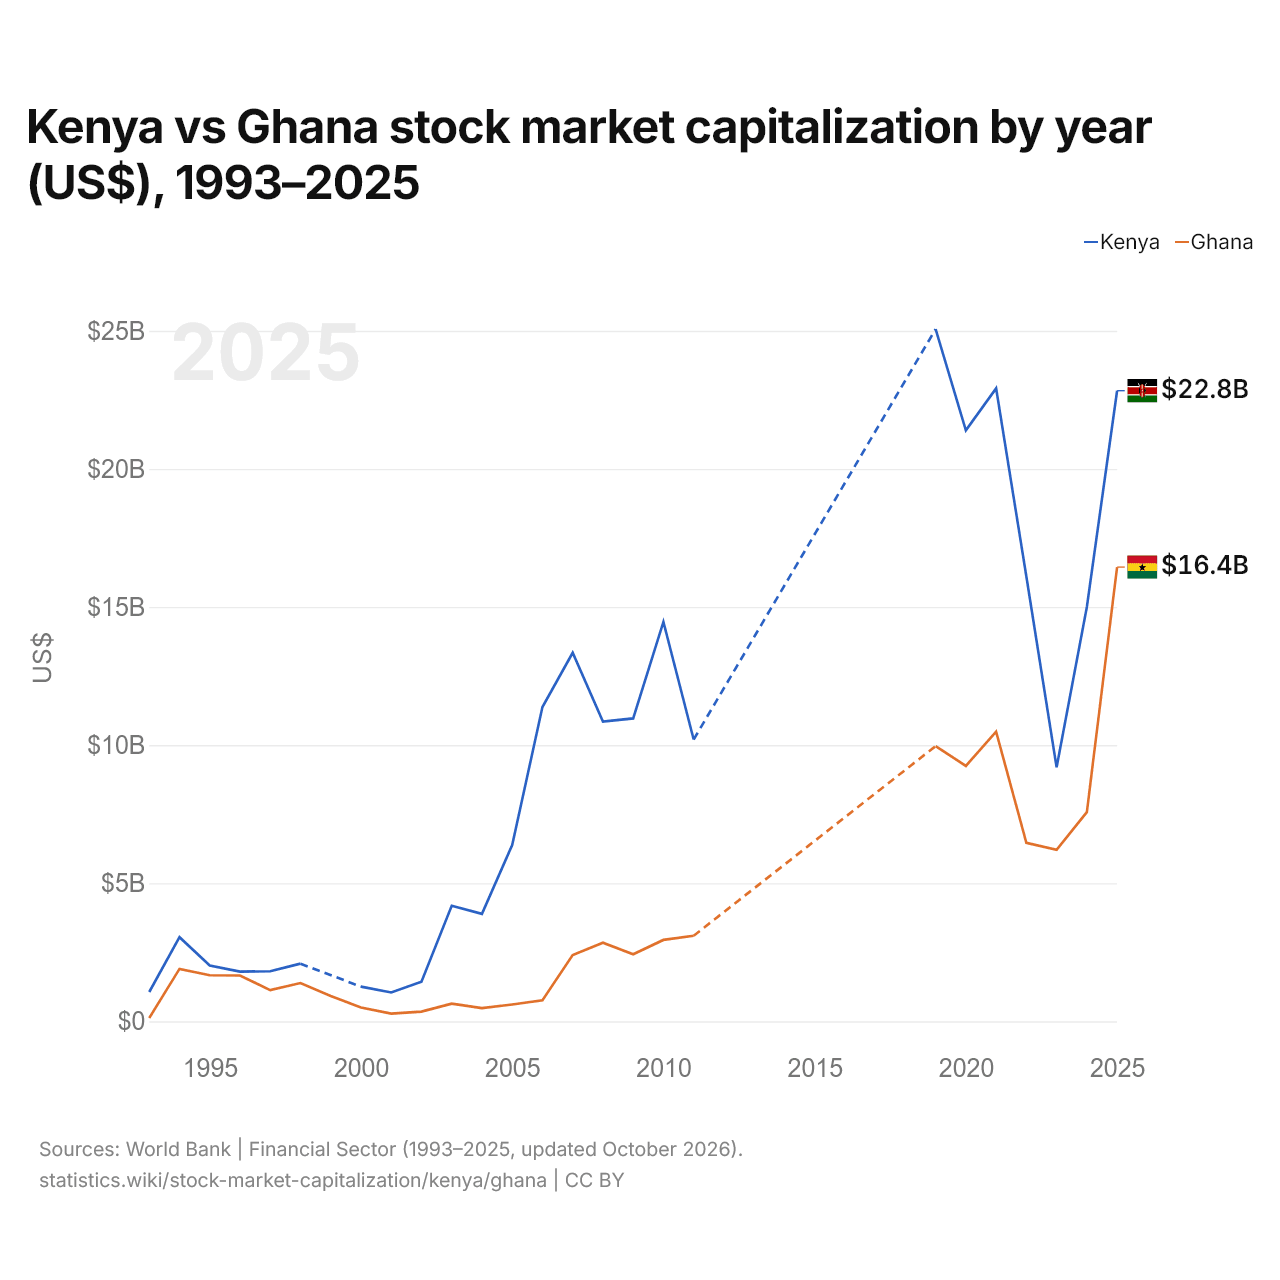
Kenya vs Ghana : capitalisation boursière par année ($ US), 1993–2025
| Année | $ US | |
|---|---|---|
 Kenya |
 Ghana |
|
| 2025 | 22 831 200 000 $ US | 16 444 520 000 $ US |
| 2024 | 15 001 870 000 $ US | 7 575 240 000 $ US |
| 2023 | 9 195 020 000 $ US | 6 209 510 000 $ US |
| 2022 | 16 107 680 000 $ US | 6 463 660 000 $ US |
| 2021 | 22 915 780 000 $ US | 10 487 020 000 $ US |
| 2020 | 21 398 330 000 $ US | 9 247 430 000 $ US |
| 2019 | 25 061 520 000 $ US | 9 963 380 000 $ US |
| 2018 | - | - |
| 2017 | - | - |
| 2016 | - | - |
| 2015 | - | - |
| 2014 | - | - |
| 2013 | - | - |
| 2012 | - | - |
| 2011 | 10 202 610 000 $ US | 3 098 510 000 $ US |
| 2010 | 14 460 870 000 $ US | 2 947 690 000 $ US |
| 2009 | 10 966 800 000 $ US | 2 427 020 000 $ US |
| 2008 | 10 854 100 000 $ US | 2 844 380 000 $ US |
| 2007 | 13 344 620 000 $ US | 2 401 290 000 $ US |
| 2006 | 11 378 040 000 $ US | 760 000 000 $ US |
| 2005 | 6 383 990 000 $ US | 610 000 000 $ US |
| 2004 | 3 890 970 000 $ US | 480 000 000 $ US |
| 2003 | 4 182 760 000 $ US | 640 000 000 $ US |
| 2002 | 1 431 290 000 $ US | 350 000 000 $ US |
| 2001 | 1 045 300 000 $ US | 280 000 000 $ US |
| 2000 | 1 255 390 000 $ US | 500 000 000 $ US |
| 1999 | - | 920 000 000 $ US |
| 1998 | 2 088 570 000 $ US | 1 387 010 000 $ US |
| 1997 | 1 813 020 000 $ US | 1 129 550 000 $ US |
| 1996 | 1 799 020 000 $ US | 1 658 590 000 $ US |
| 1995 | 2 017 510 000 $ US | 1 668 300 000 $ US |
| 1994 | 3 046 700 000 $ US | 1 899 400 000 $ US |
| 1993 | 1 063 100 000 $ US | 122 100 000 $ US |
En 2025, les sociétés cotées valaient 22,8 milliards de dollars au Kenya et 16,4 milliards de dollars au Ghana : 39 % de plus au Kenya. En 1993, les sociétés cotées valaient 8,7 fois plus au Kenya : 1,06 milliard de dollars au Kenya et 122 millions de dollars au Ghana.
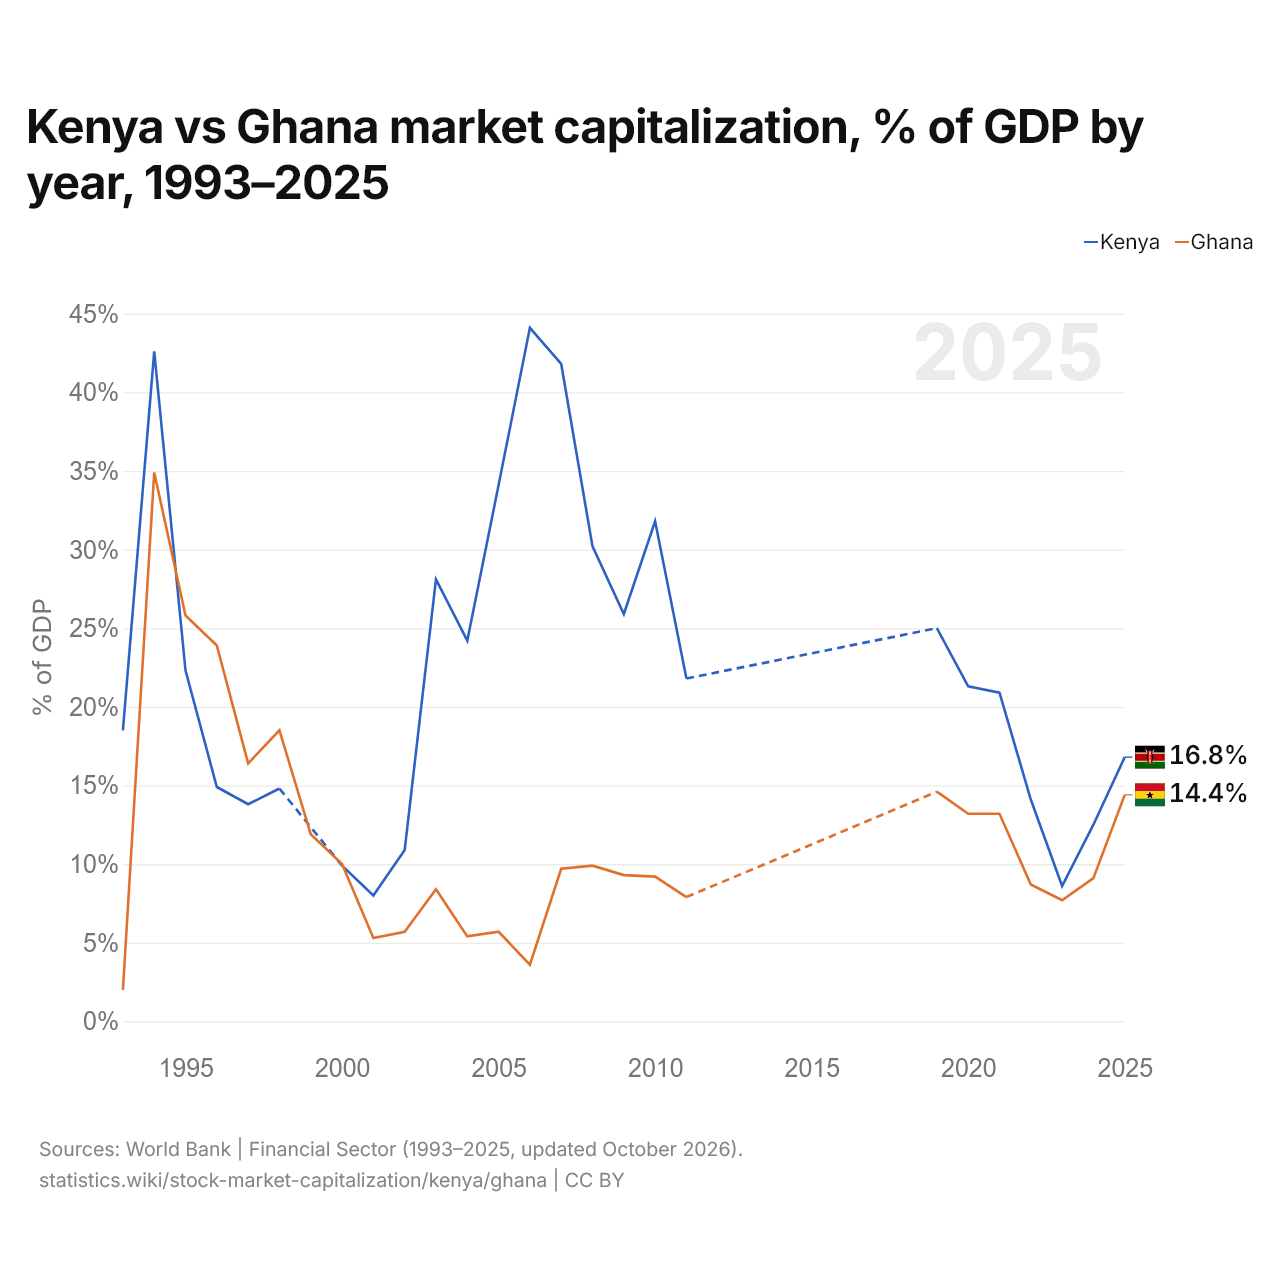
Kenya vs Ghana : capitalisation boursière, % du PIB par année, 1993–2025
| Année | % du PIB | |
|---|---|---|
|
Kenya
|
Ghana
|
|
| 2025 | 16,8 % | 14,4 % |
| 2024 | 12,5 % | 9,1 % |
| 2023 | 8,6 % | 7,7 % |
| 2022 | 14,1 % | 8,7 % |
| 2021 | 20,9 % | 13,2 % |
| 2020 | 21,3 % | 13,2 % |
| 2019 | 25 % | 14,6 % |
| 2018 | - | - |
| 2017 | - | - |
| 2016 | - | - |
| 2015 | - | - |
| 2014 | - | - |
| 2013 | - | - |
| 2012 | - | - |
| 2011 | 21,8 % | 7,9 % |
| 2010 | 31,8 % | 9,2 % |
| 2009 | 25,9 % | 9,3 % |
| 2008 | 30,2 % | 9,9 % |
| 2007 | 41,8 % | 9,7 % |
| 2006 | 44,1 % | 3,6 % |
| 2005 | 34,1 % | 5,7 % |
| 2004 | 24,2 % | 5,4 % |
| 2003 | 28,1 % | 8,4 % |
| 2002 | 10,9 % | 5,7 % |
| 2001 | 8 % | 5,3 % |
| 2000 | 9,9 % | 10 % |
| 1999 | - | 11,9 % |
| 1998 | 14,8 % | 18,5 % |
| 1997 | 13,8 % | 16,4 % |
| 1996 | 14,9 % | 23,9 % |
| 1995 | 22,3 % | 25,8 % |
| 1994 | 42,6 % | 34,9 % |
| 1993 | 18,5 % | 2 % |
En 2025, la capitalisation boursière équivalait à 16,8 % du PIB au Kenya et à 14,4 % au Ghana : 2,4 points de pourcentage de plus au Kenya.
Kenya vs Ghana : dernière capitalisation boursière et sociétés cotées
|
Kenya
|
Ghana
|
|
|---|---|---|
| Capitalisation boursière | 22,8 Md $US | 16,4 Md $US |
| % du PIB | 16,8 % | 14,4 % |
| Sociétés nationales cotées | 59 | 31 |
| Rang mondial | 54/77 | 57/77 |
| Écart de capitalisation boursière | 1,4× | 0,72× |
Comparer la capitalisation boursière de 2 pays au choix
Sources :
- Banque mondiale | Secteur financier (1993–2025, mis à jour en octobre 2026)
Creative Commons Attribution (CC BY) : vous pouvez copier, partager, adapter et réutiliser ce contenu, y compris à des fins commerciales, à condition de citer statistics.wiki et d’indiquer les modifications apportées. Les sources citées ci-dessus peuvent avoir leurs propres conditions de licence.