
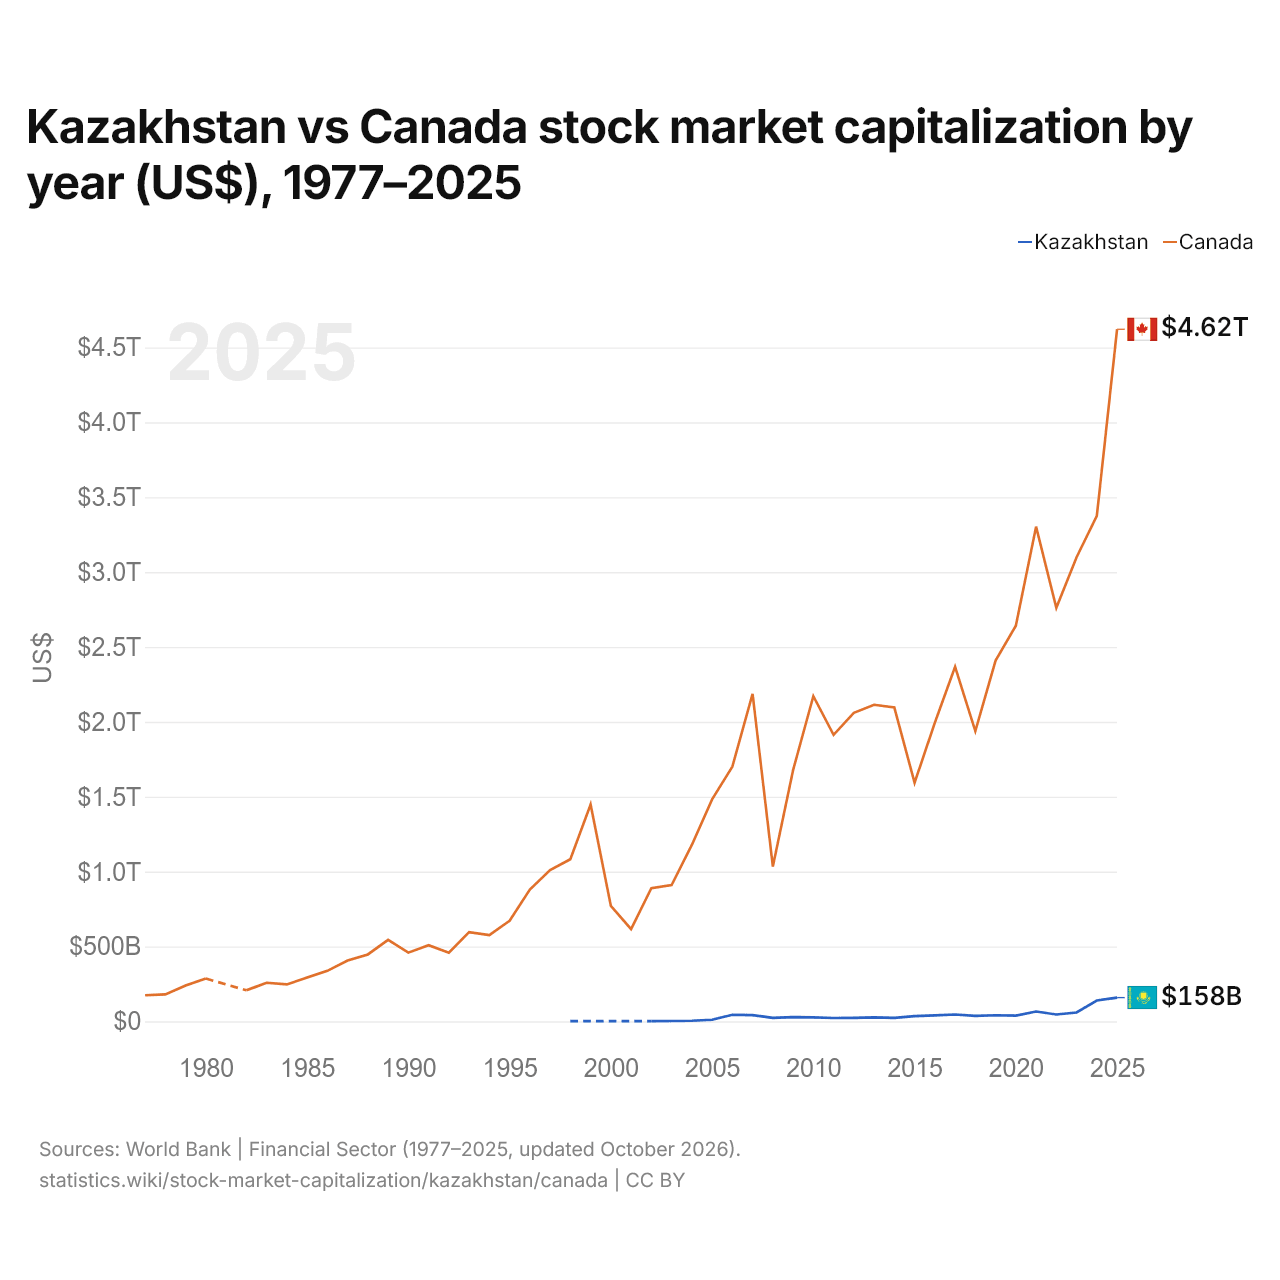
Kazakhstan vs Canada : capitalisation boursière par année ($ US), 1977–2025
| Année | $ US | |
|---|---|---|
 Kazakhstan |
 Canada |
|
| 2025 | 158 407 040 000 $ US | 4 621 231 170 000 $ US |
| 2024 | 139 030 570 000 $ US | 3 374 477 170 000 $ US |
| 2023 | 59 078 400 000 $ US | 3 099 135 030 000 $ US |
| 2022 | 45 788 490 000 $ US | 2 760 871 360 000 $ US |
| 2021 | 65 789 580 000 $ US | 3 302 816 830 000 $ US |
| 2020 | 38 252 840 000 $ US | 2 641 455 040 000 $ US |
| 2019 | 40 678 820 000 $ US | 2 409 098 540 000 $ US |
| 2018 | 37 005 250 000 $ US | 1 937 902 710 000 $ US |
| 2017 | 45 558 250 000 $ US | 2 367 059 920 000 $ US |
| 2016 | 40 161 214 777 $ US | 1 993 522 735 730 $ US |
| 2015 | 34 891 880 000 $ US | 1 593 399 300 000 $ US |
| 2014 | 22 973 440 000 $ US | 2 095 420 680 000 $ US |
| 2013 | 26 228 210 000 $ US | 2 113 821 770 000 $ US |
| 2012 | 23 542 600 000 $ US | 2 059 973 580 000 $ US |
| 2011 | 22 537 310 000 $ US | 1 912 871 970 000 $ US |
| 2010 | 26 672 730 000 $ US | 2 171 194 840 000 $ US |
| 2009 | 27 929 370 000 $ US | 1 677 431 720 000 $ US |
| 2008 | 23 271 810 000 $ US | 1 033 651 810 000 $ US |
| 2007 | 41 377 500 000 $ US | 2 186 550 150 000 $ US |
| 2006 | 43 688 350 000 $ US | 1 700 708 090 000 $ US |
| 2005 | 10 528 660 000 $ US | 1 482 184 560 000 $ US |
| 2004 | 3 941 880 000 $ US | 1 177 517 940 000 $ US |
| 2003 | 2 425 900 000 $ US | 910 230 610 000 $ US |
| 2002 | 1 289 440 000 $ US | 888 677 700 000 $ US |
| 2001 | - | 615 265 930 000 $ US |
| 2000 | - | 770 841 540 000 $ US |
| 1999 | - | 1 448 278 090 000 $ US |
| 1998 | 1 693 670 000 $ US | 1 081 927 730 000 $ US |
| 1997 | - | 1 010 507 310 000 $ US |
| 1996 | - | 879 797 610 000 $ US |
| 1995 | - | 671 742 800 000 $ US |
| 1994 | - | 575 716 370 000 $ US |
| 1993 | - | 595 516 360 000 $ US |
| 1992 | - | 457 949 900 000 $ US |
| 1991 | - | 508 633 200 000 $ US |
| 1990 | - | 458 678 620 000 $ US |
| 1989 | - | 543 396 610 000 $ US |
| 1988 | - | 446 806 410 000 $ US |
| 1987 | - | 405 600 860 000 $ US |
| 1986 | - | 336 895 680 000 $ US |
| 1985 | - | 292 880 140 000 $ US |
| 1984 | - | 246 632 360 000 $ US |
| 1983 | - | 257 634 200 000 $ US |
| 1982 | - | 207 092 900 000 $ US |
| 1981 | - | - |
| 1980 | - | 285 706 860 000 $ US |
| 1979 | - | 238 944 270 000 $ US |
| 1978 | - | 179 690 430 000 $ US |
| 1977 | - | 173 941 850 000 $ US |
En 2025, les sociétés cotées valaient 158 milliards de dollars au Kazakhstan et 4,62 billions de dollars au Canada : 29 fois plus au Canada. En 1998, les sociétés cotées valaient 640 fois plus au Canada : 1,69 milliard de dollars au Kazakhstan et 1,08 billion de dollars au Canada.
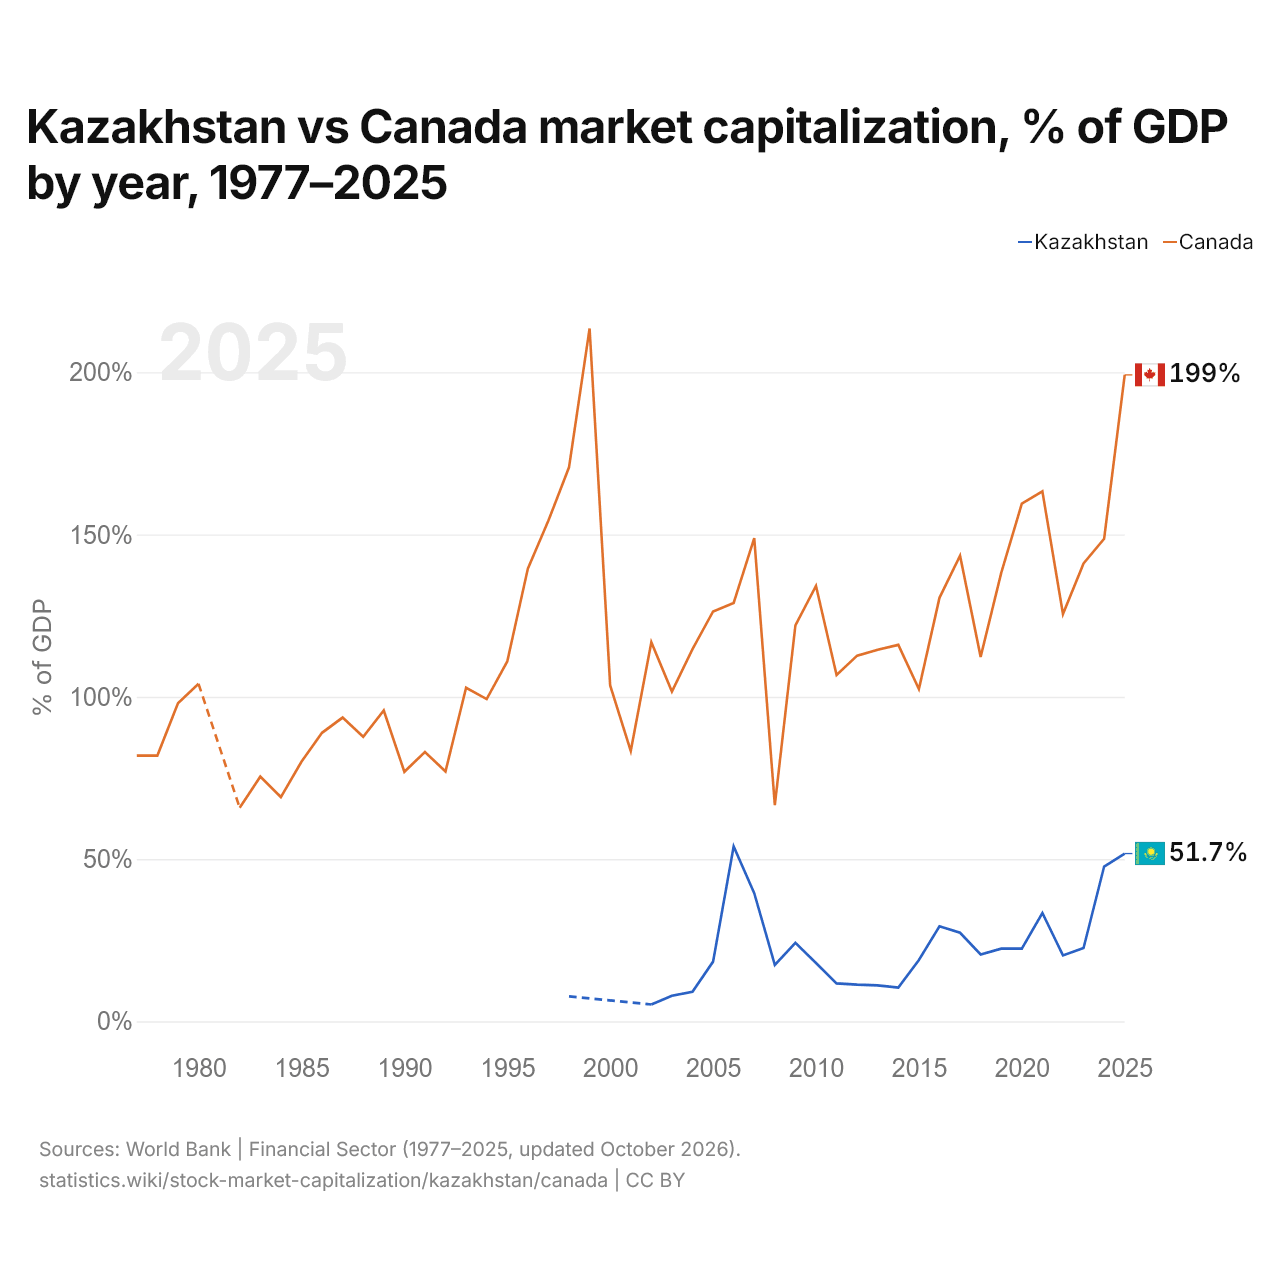
Kazakhstan vs Canada : capitalisation boursière, % du PIB par année, 1977–2025
| Année | % du PIB | |
|---|---|---|
|
Kazakhstan
|
Canada
|
|
| 2025 | 51,7 % | 199,2 % |
| 2024 | 47,7 % | 148,7 % |
| 2023 | 22,6 % | 141,1 % |
| 2022 | 20,3 % | 125,5 % |
| 2021 | 33,4 % | 163,3 % |
| 2020 | 22,4 % | 159,5 % |
| 2019 | 22,4 % | 138,2 % |
| 2018 | 20,6 % | 112,3 % |
| 2017 | 27,3 % | 143,5 % |
| 2016 | 29,3 % | 130,5 % |
| 2015 | 18,9 % | 102,4 % |
| 2014 | 10,4 % | 116 % |
| 2013 | 11,1 % | 114,5 % |
| 2012 | 11,3 % | 112,7 % |
| 2011 | 11,7 % | 106,7 % |
| 2010 | 18 % | 134,2 % |
| 2009 | 24,2 % | 122 % |
| 2008 | 17,4 % | 66,6 % |
| 2007 | 39,5 % | 148,9 % |
| 2006 | 53,9 % | 128,9 % |
| 2005 | 18,4 % | 126,3 % |
| 2004 | 9,1 % | 114,7 % |
| 2003 | 7,9 % | 101,6 % |
| 2002 | 5,2 % | 116,8 % |
| 2001 | - | 83,3 % |
| 2000 | - | 103,5 % |
| 1999 | - | 213,5 % |
| 1998 | 7,7 % | 170,7 % |
| 1997 | - | 154,3 % |
| 1996 | - | 139,5 % |
| 1995 | - | 110,9 % |
| 1994 | - | 99,3 % |
| 1993 | - | 102,8 % |
| 1992 | - | 77 % |
| 1991 | - | 83 % |
| 1990 | - | 76,9 % |
| 1989 | - | 95,8 % |
| 1988 | - | 87,7 % |
| 1987 | - | 93,6 % |
| 1986 | - | 88,9 % |
| 1985 | - | 80 % |
| 1984 | - | 69,1 % |
| 1983 | - | 75,4 % |
| 1982 | - | 65,8 % |
| 1981 | - | - |
| 1980 | - | 104 % |
| 1979 | - | 98 % |
| 1978 | - | 81,9 % |
| 1977 | - | 81,9 % |
En 2025, la capitalisation boursière équivalait à 51,7 % du PIB au Kazakhstan et à 199,2 % au Canada : 147,5 points de pourcentage de plus au Canada. En 2015, les parts étaient de 18,9 % au Kazakhstan et de 102,4 % au Canada, soit 83,5 points de pourcentage de plus au Canada.
Kazakhstan vs Canada : dernière capitalisation boursière et sociétés cotées
|
Kazakhstan
|
Canada
|
|
|---|---|---|
| Capitalisation boursière | 158 Md $US | 4,62 Bn $US |
| % du PIB | 51,7 % | 199,2 % |
| Sociétés nationales cotées | 80 | 4 377 |
| Rang mondial | 32/77 | 5/77 |
| Écart de capitalisation boursière | 0,034× | 29× |
Comparer la capitalisation boursière de 2 pays au choix
Sources :
- Banque mondiale | Secteur financier (1977–2025, mis à jour en octobre 2026)
Creative Commons Attribution (CC BY) : vous pouvez copier, partager, adapter et réutiliser ce contenu, y compris à des fins commerciales, à condition de citer statistics.wiki et d’indiquer les modifications apportées. Les sources citées ci-dessus peuvent avoir leurs propres conditions de licence.