
Espagne vs Brésil : dépenses militaires ($ US), 1960–2025
| Année | $ US | |
|---|---|---|
 Espagne |
 Brésil |
|
| 2025 | 40 586 887 508 $ US | 24 041 602 560 $ US |
| 2024 | 25 200 122 783 $ US | 20 963 640 494 $ US |
| 2023 | 24 857 846 735 $ US | 21 788 291 369 $ US |
| 2022 | 20 747 343 286 $ US | 20 542 063 933 $ US |
| 2021 | 19 972 805 515 $ US | 19 196 367 283 $ US |
| 2020 | 17 486 085 827 $ US | 19 582 928 160 $ US |
| 2019 | 17 187 851 886 $ US | 25 903 777 717 $ US |
| 2018 | 17 832 897 289 $ US | 28 172 750 473 $ US |
| 2017 | 16 153 299 846 $ US | 29 178 548 902 $ US |
| 2016 | 14 027 196 491 $ US | 24 205 506 642 $ US |
| 2015 | 15 193 969 093 $ US | 24 609 516 836 $ US |
| 2014 | 17 201 428 155 $ US | 32 671 384 712 $ US |
| 2013 | 17 247 857 259 $ US | 32 874 802 475 $ US |
| 2012 | 18 859 554 242 $ US | 33 987 022 473 $ US |
| 2011 | 19 721 235 943 $ US | 36 936 231 974 $ US |
| 2010 | 19 730 018 063 $ US | 34 003 002 454 $ US |
| 2009 | 20 328 954 964 $ US | 25 648 835 222 $ US |
| 2008 | 22 375 850 012 $ US | 24 452 942 953 $ US |
| 2007 | 20 129 621 716 $ US | 20 485 779 340 $ US |
| 2006 | 17 287 393 714 $ US | 16 404 890 078 $ US |
| 2005 | 16 017 291 406 $ US | 13 588 619 758 $ US |
| 2004 | 15 300 926 415 $ US | 9 780 114 929 $ US |
| 2003 | 12 916 179 835 $ US | 8 392 919 520 $ US |
| 2002 | 10 321 954 149 $ US | 9 664 551 976 $ US |
| 2001 | 10 230 507 087 $ US | 10 930 222 264 $ US |
| 2000 | 10 320 372 348 $ US | 11 344 013 932 $ US |
| 1999 | 11 135 118 793 $ US | 9 866 957 600 $ US |
| 1998 | 10 873 091 809 $ US | 14 357 394 162 $ US |
| 1997 | 10 160 129 272 $ US | 13 934 240 699 $ US |
| 1996 | 11 653 260 202 $ US | 14 073 226 544 $ US |
| 1995 | 11 773 776 493 $ US | 14 326 035 244 $ US |
| 1994 | 10 610 763 722 $ US | 10 591 489 382 $ US |
| 1993 | 10 556 302 524 $ US | 7 100 386 157 $ US |
| 1992 | 12 879 169 417 $ US | 4 993 534 629 $ US |
| 1991 | 12 280 199 281 $ US | 6 725 085 985 $ US |
| 1990 | 12 296 136 691 $ US | 9 099 838 113 $ US |
| 1989 | 9 779 928 333 $ US | 11 093 965 910 $ US |
| 1988 | 9 357 355 244 $ US | 6 521 161 599 $ US |
| 1987 | 8 328 351 259 $ US | 4 936 494 341 $ US |
| 1986 | 6 592 557 942 $ US | 3 130 063 412 $ US |
| 1985 | 5 338 127 968 $ US | 3 014 576 139 $ US |
| 1984 | 5 100 935 591 $ US | 2 259 215 294 $ US |
| 1983 | 5 016 007 812 $ US | 2 379 393 210 $ US |
| 1982 | 5 210 390 412 $ US | 3 536 672 699 $ US |
| 1981 | 5 232 979 664 $ US | 2 949 497 292 $ US |
| 1980 | 5 791 511 464 $ US | 2 702 569 201 $ US |
| 1979 | 5 354 922 378 $ US | 3 368 616 267 $ US |
| 1978 | 3 784 167 057 $ US | 3 203 800 523 $ US |
| 1977 | 3 062 994 910 $ US | 2 976 206 092 $ US |
| 1976 | 2 748 642 597 $ US | 3 067 596 285 $ US |
| 1975 | 2 298 789 789 $ US | 2 548 079 899 $ US |
| 1974 | 2 145 851 987 $ US | 2 131 499 654 $ US |
| 1973 | 1 658 691 668 $ US | 1 801 122 064 $ US |
| 1972 | 1 369 581 522 $ US | 1 423 363 287 $ US |
| 1971 | 982 022 242 $ US | 1 279 923 771 $ US |
| 1970 | 936 682 959 $ US | 1 222 122 245 $ US |
| 1969 | 902 849 517 $ US | 972 257 722 $ US |
| 1968 | 744 315 537 $ US | 899 068 956 $ US |
| 1967 | 603 199 144 $ US | 888 129 438 $ US |
| 1966 | 614 723 758 $ US | 854 716 848 $ US |
| 1965 | 480 256 897 $ US | 753 065 031 $ US |
| 1964 | 424 083 408 $ US | 422 314 015 $ US |
| 1963 | 386 672 717 $ US | 526 497 737 $ US |
| 1962 | 376 664 265 $ US | 461 308 725 $ US |
| 1961 | 289 211 213 $ US | 408 414 668 $ US |
| 1960 | 279 644 379 $ US | 456 269 116 $ US |
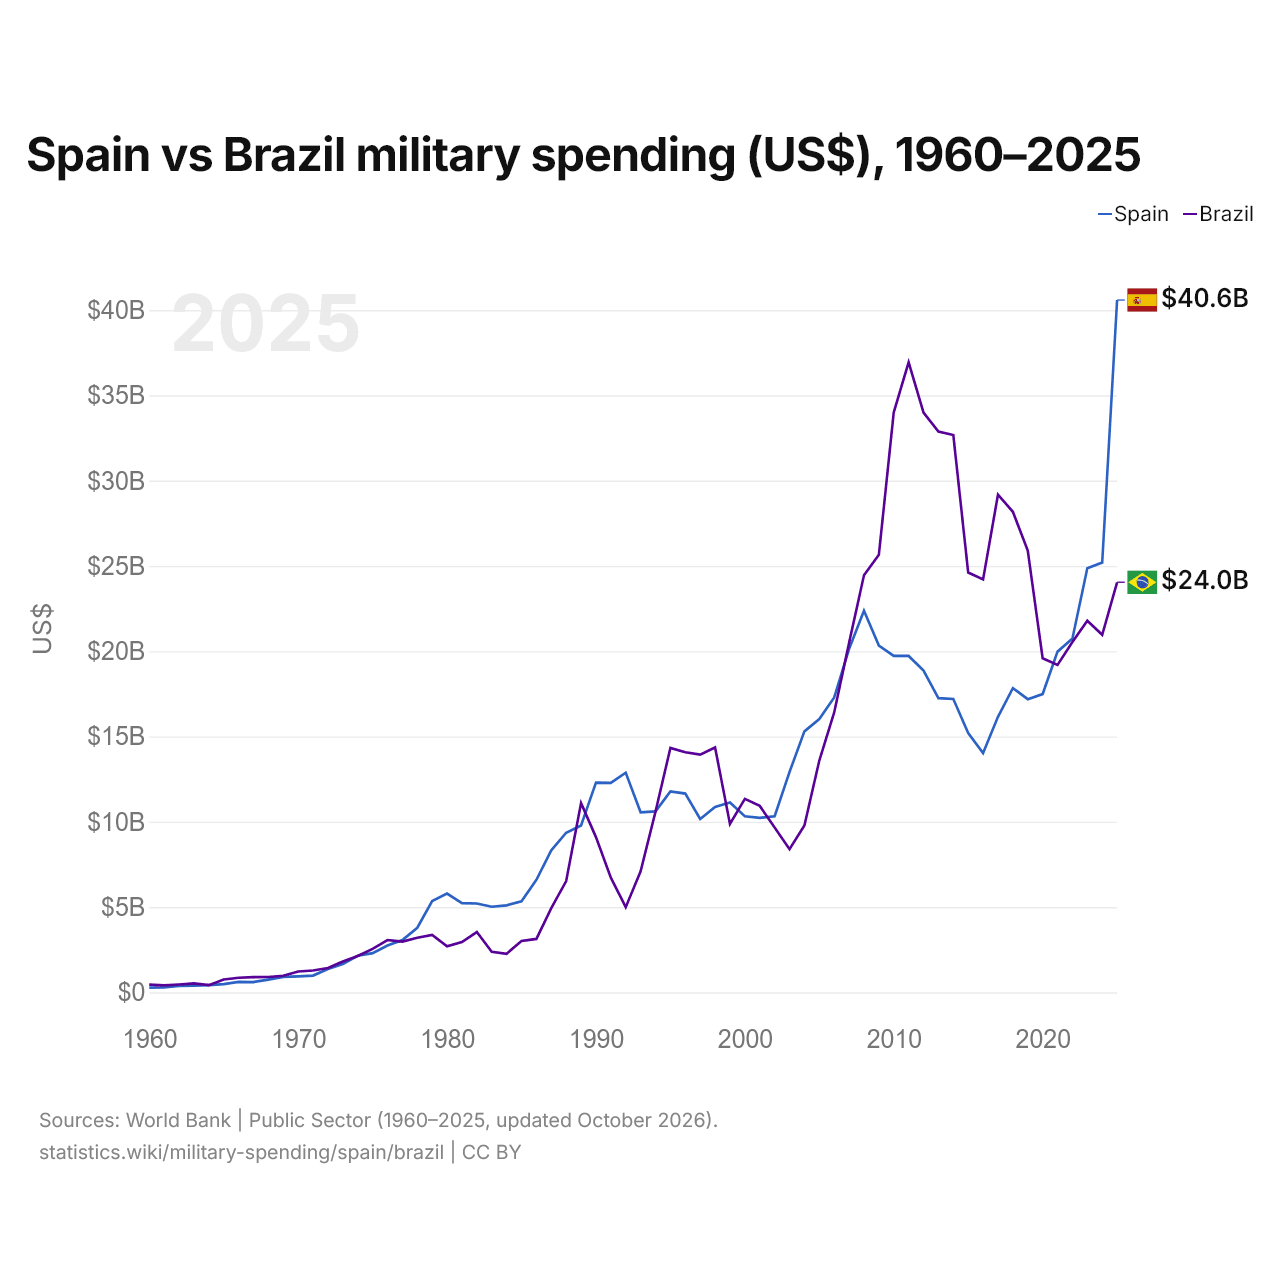
En 2025, les dépenses militaires s'élevaient à 40,6 milliards de dollars en Espagne et à 24 milliards de dollars au Brésil : 1,7 fois plus en Espagne. En 1960, elles s'élevaient à 280 millions de dollars en Espagne et à 456 millions de dollars au Brésil, soit 1,6 fois plus au Brésil.
Espagne vs Brésil : dépenses militaires en % du PIB, 1960–2025
| Année | % du PIB | |
|---|---|---|
|
Espagne
|
Brésil
|
|
| 2025 | 2,1 % | 1,1 % |
| 2024 | 1,5 % | 1 % |
| 2023 | 1,5 % | 1 % |
| 2022 | 1,4 % | 1,1 % |
| 2021 | 1,4 % | 1,1 % |
| 2020 | 1,4 % | 1,3 % |
| 2019 | 1,2 % | 1,4 % |
| 2018 | 1,2 % | 1,5 % |
| 2017 | 1,2 % | 1,4 % |
| 2016 | 1,1 % | 1,3 % |
| 2015 | 1,3 % | 1,4 % |
| 2014 | 1,2 % | 1,3 % |
| 2013 | 1,3 % | 1,3 % |
| 2012 | 1,4 % | 1,4 % |
| 2011 | 1,3 % | 1,4 % |
| 2010 | 1,4 % | 1,5 % |
| 2009 | 1,4 % | 1,5 % |
| 2008 | 1,4 % | 1,4 % |
| 2007 | 1,4 % | 1,5 % |
| 2006 | 1,4 % | 1,5 % |
| 2005 | 1,4 % | 1,5 % |
| 2004 | 1,4 % | 1,5 % |
| 2003 | 1,4 % | 1,5 % |
| 2002 | 1,5 % | 1,9 % |
| 2001 | 1,6 % | 2 % |
| 2000 | 1,7 % | 1,7 % |
| 1999 | 1,8 % | 1,6 % |
| 1998 | 1,8 % | 1,7 % |
| 1997 | 1,7 % | 1,6 % |
| 1996 | 1,8 % | 1,7 % |
| 1995 | 1,9 % | 1,9 % |
| 1994 | 2 % | 2 % |
| 1993 | 2 % | 1,9 % |
| 1992 | 2 % | 1,5 % |
| 1991 | 2,1 % | 2 % |
| 1990 | 2,3 % | 2,4 % |
| 1989 | 2,4 % | 2,7 % |
| 1988 | 2,5 % | 2,1 % |
| 1987 | 2,6 % | 1,7 % |
| 1986 | 2,6 % | 1,2 % |
| 1985 | 3 % | 1,4 % |
| 1984 | 3 % | 1,2 % |
| 1983 | 2,9 % | 1,3 % |
| 1982 | 2,7 % | 1,3 % |
| 1981 | 2,6 % | 1,1 % |
| 1980 | 2,5 % | 1,1 % |
| 1979 | 2,5 % | 1,5 % |
| 1978 | 2,4 % | 1,6 % |
| 1977 | 2,3 % | 1,7 % |
| 1976 | 2,3 % | 2 % |
| 1975 | 2 % | 2 % |
| 1974 | 2,2 % | 1,9 % |
| 1973 | 2,1 % | 2,2 % |
| 1972 | 2,3 % | 2,4 % |
| 1971 | 2,1 % | 2,6 % |
| 1970 | 2,3 % | 2,9 % |
| 1969 | 2,4 % | 2,6 % |
| 1968 | 2,3 % | 2,6 % |
| 1967 | 1,9 % | 2,9 % |
| 1966 | 2,1 % | 3 % |
| 1965 | 1,9 % | 3,4 % |
| 1964 | 1,9 % | 2 % |
| 1963 | 2 % | 2,3 % |
| 1962 | 2,3 % | 2,4 % |
| 1961 | 2 % | 2,4 % |
| 1960 | 2,3 % | 2,7 % |
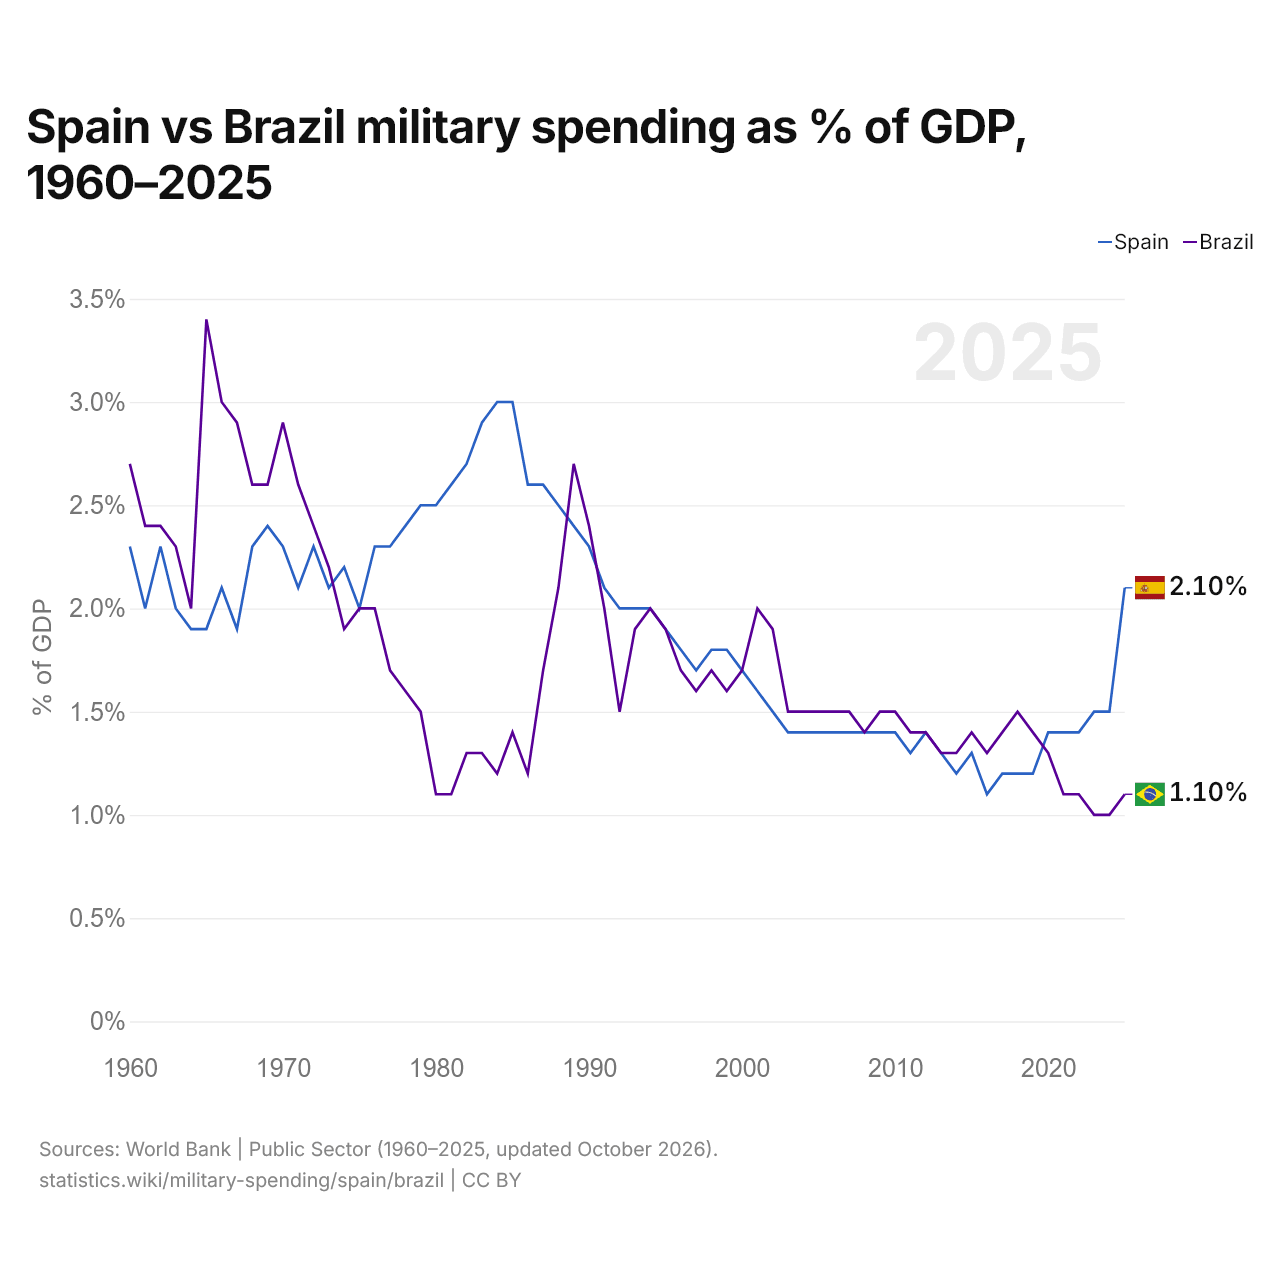
En 2025, les dépenses militaires représentaient 2,1 % du PIB en Espagne et 1,1 % au Brésil : 1,0 points de pourcentage de plus en Espagne. En 2015, elles représentaient 1,3 % en Espagne et 1,4 % au Brésil, soit 0,1 points de pourcentage de plus au Brésil.
Les dépenses militaires de l'Espagne, en part du PIB, sont supérieures à celles du Brésil chaque année depuis 2020. L'écart a été le plus grand en 1984, quand les dépenses militaires de l'Espagne dépassaient celles du Brésil de 1,8 point de pourcentage du PIB.
Espagne vs Brésil : chiffres des dépenses militaires
|
Espagne
|
Brésil
|
|
|---|---|---|
| $ US, 2025 | 40,6 Md $US | 24,0 Md $US |
| % du PIB, 2025 | 2,1 % | 1,1 % |
| Par personne, $ US | 822 $US | 113 $US |
| Part mondiale | 1,42 % | 0,84 % |
| Rang mondial | 15/154 | 21/154 |
Comparer les dépenses militaires de 2 pays au choix
Sources :
- Banque mondiale | Secteur public (1960–2025, mis à jour en octobre 2026)
Creative Commons Attribution (CC BY) : vous pouvez copier, partager, adapter et réutiliser ce contenu, y compris à des fins commerciales, à condition de citer statistics.wiki et d’indiquer les modifications apportées. Les sources citées ci-dessus peuvent avoir leurs propres conditions de licence.