
Pakistan vs Brésil : dépenses militaires ($ US), 1960–2025
| Année | $ US | |
|---|---|---|
 Pakistan |
 Brésil |
|
| 2025 | 11 867 353 975 $ US | 24 041 602 560 $ US |
| 2024 | 10 148 530 941 $ US | 20 963 640 494 $ US |
| 2023 | 9 733 805 487 $ US | 21 788 291 369 $ US |
| 2022 | 11 909 634 966 $ US | 20 542 063 933 $ US |
| 2021 | 11 812 061 426 $ US | 19 196 367 283 $ US |
| 2020 | 10 474 876 919 $ US | 19 582 928 160 $ US |
| 2019 | 11 250 573 674 $ US | 25 903 777 717 $ US |
| 2018 | 12 774 181 170 $ US | 28 172 750 473 $ US |
| 2017 | 11 412 397 576 $ US | 29 178 548 902 $ US |
| 2016 | 10 048 004 917 $ US | 24 205 506 642 $ US |
| 2015 | 9 487 808 309 $ US | 24 609 516 836 $ US |
| 2014 | 8 403 822 344 $ US | 32 671 384 712 $ US |
| 2013 | 7 987 387 137 $ US | 32 874 802 475 $ US |
| 2012 | 7 742 745 270 $ US | 33 987 022 473 $ US |
| 2011 | 6 731 383 052 $ US | 36 936 231 974 $ US |
| 2010 | 5 983 696 738 $ US | 34 003 002 454 $ US |
| 2009 | 6 116 998 267 $ US | 25 648 835 222 $ US |
| 2008 | 6 994 977 847 $ US | 24 452 942 953 $ US |
| 2007 | 6 467 001 759 $ US | 20 485 779 340 $ US |
| 2006 | 5 900 625 105 $ US | 16 404 890 078 $ US |
| 2005 | 5 658 805 858 $ US | 13 588 619 758 $ US |
| 2004 | 5 230 511 980 $ US | 9 780 114 929 $ US |
| 2003 | 4 597 615 030 $ US | 8 392 919 520 $ US |
| 2002 | 3 989 170 297 $ US | 9 664 551 976 $ US |
| 2001 | 3 768 214 371 $ US | 10 930 222 264 $ US |
| 2000 | 4 147 245 552 $ US | 11 344 013 932 $ US |
| 1999 | 3 268 279 745 $ US | 9 866 957 600 $ US |
| 1998 | 3 367 753 517 $ US | 14 357 394 162 $ US |
| 1997 | 3 509 513 229 $ US | 13 934 240 699 $ US |
| 1996 | 3 822 743 973 $ US | 14 073 226 544 $ US |
| 1995 | 3 529 155 975 $ US | 14 326 035 244 $ US |
| 1994 | 3 097 628 998 $ US | 10 591 489 382 $ US |
| 1993 | 3 329 990 628 $ US | 7 100 386 157 $ US |
| 1992 | 3 274 387 010 $ US | 4 993 534 629 $ US |
| 1991 | 2 998 019 333 $ US | 6 725 085 985 $ US |
| 1990 | 2 609 607 979 $ US | 9 099 838 113 $ US |
| 1989 | 2 624 268 005 $ US | 11 093 965 910 $ US |
| 1988 | 2 610 687 510 $ US | 6 521 161 599 $ US |
| 1987 | 2 325 228 627 $ US | 4 936 494 341 $ US |
| 1986 | 2 230 273 249 $ US | 3 130 063 412 $ US |
| 1985 | 2 155 893 030 $ US | 3 014 576 139 $ US |
| 1984 | 2 074 553 156 $ US | 2 259 215 294 $ US |
| 1983 | 1 906 231 215 $ US | 2 379 393 210 $ US |
| 1982 | 1 959 001 019 $ US | 3 536 672 699 $ US |
| 1981 | 1 604 789 243 $ US | 2 949 497 292 $ US |
| 1980 | 1 306 492 794 $ US | 2 702 569 201 $ US |
| 1979 | 1 073 661 575 $ US | 3 368 616 267 $ US |
| 1978 | 980 221 053 $ US | 3 203 800 523 $ US |
| 1977 | 839 104 852 $ US | 2 976 206 092 $ US |
| 1976 | 775 530 431 $ US | 3 067 596 285 $ US |
| 1975 | 709 945 036 $ US | 2 548 079 899 $ US |
| 1974 | 542 049 452 $ US | 2 131 499 654 $ US |
| 1973 | 396 451 999 $ US | 1 801 122 064 $ US |
| 1972 | 646 430 835 $ US | 1 423 363 287 $ US |
| 1971 | 718 405 016 $ US | 1 279 923 771 $ US |
| 1970 | 617 532 901 $ US | 1 222 122 245 $ US |
| 1969 | 478 617 009 $ US | 972 257 722 $ US |
| 1968 | 410 456 077 $ US | 899 068 956 $ US |
| 1967 | 403 427 222 $ US | 888 129 438 $ US |
| 1966 | 441 596 869 $ US | 854 716 848 $ US |
| 1965 | 350 101 423 $ US | 753 065 031 $ US |
| 1964 | 201 217 876 $ US | 422 314 015 $ US |
| 1963 | 168 951 707 $ US | 526 497 737 $ US |
| 1962 | 157 574 105 $ US | 461 308 725 $ US |
| 1961 | 168 777 676 $ US | 408 414 668 $ US |
| 1960 | 161 693 151 $ US | 456 269 116 $ US |
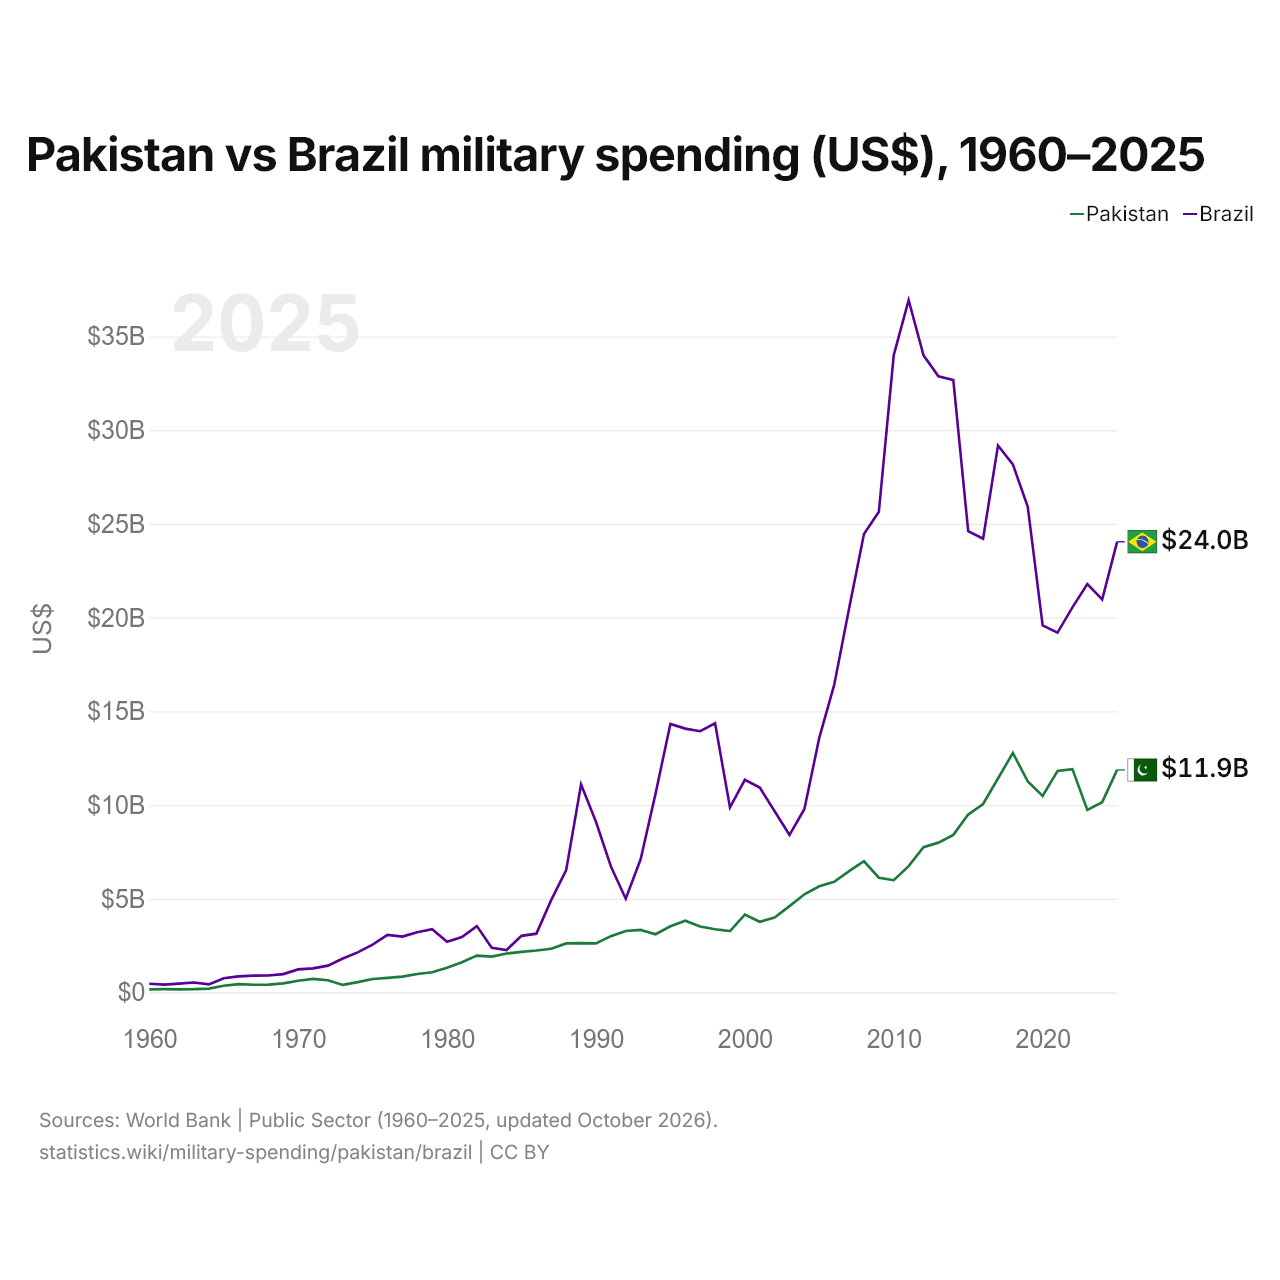
En 2025, les dépenses militaires s'élevaient à 11,9 milliards de dollars au Pakistan et à 24 milliards de dollars au Brésil : 2,0 fois plus au Brésil. En 1960, elles s'élevaient à 162 millions de dollars au Pakistan et à 456 millions de dollars au Brésil, soit 2,8 fois plus au Brésil.
Pakistan vs Brésil : dépenses militaires en % du PIB, 1960–2025
| Année | % du PIB | |
|---|---|---|
|
Pakistan
|
Brésil
|
|
| 2025 | 2,9 % | 1,1 % |
| 2024 | 2,7 % | 1 % |
| 2023 | 2,9 % | 1 % |
| 2022 | 3,2 % | 1,1 % |
| 2021 | 3,4 % | 1,1 % |
| 2020 | 3,5 % | 1,3 % |
| 2019 | 3,5 % | 1,4 % |
| 2018 | 3,6 % | 1,5 % |
| 2017 | 3,4 % | 1,4 % |
| 2016 | 3,2 % | 1,3 % |
| 2015 | 3,2 % | 1,4 % |
| 2014 | 3,1 % | 1,3 % |
| 2013 | 3,1 % | 1,3 % |
| 2012 | 3,1 % | 1,4 % |
| 2011 | 2,9 % | 1,4 % |
| 2010 | 3 % | 1,5 % |
| 2009 | 3,3 % | 1,5 % |
| 2008 | 3,5 % | 1,4 % |
| 2007 | 3,5 % | 1,5 % |
| 2006 | 3,6 % | 1,5 % |
| 2005 | 3,9 % | 1,5 % |
| 2004 | 4 % | 1,5 % |
| 2003 | 4,1 % | 1,5 % |
| 2002 | 4,1 % | 1,9 % |
| 2001 | 3,9 % | 2 % |
| 2000 | 4,2 % | 1,7 % |
| 1999 | 5,2 % | 1,6 % |
| 1998 | 5,4 % | 1,7 % |
| 1997 | 5,6 % | 1,6 % |
| 1996 | 6 % | 1,7 % |
| 1995 | 5,8 % | 1,9 % |
| 1994 | 5,9 % | 2 % |
| 1993 | 6,4 % | 1,9 % |
| 1992 | 6,7 % | 1,5 % |
| 1991 | 6,6 % | 2 % |
| 1990 | 6,5 % | 2,4 % |
| 1989 | 6,5 % | 2,7 % |
| 1988 | 6,8 % | 2,1 % |
| 1987 | 7 % | 1,7 % |
| 1986 | 7 % | 1,2 % |
| 1985 | 6,9 % | 1,4 % |
| 1984 | 6,7 % | 1,2 % |
| 1983 | 6,6 % | 1,3 % |
| 1982 | 6,4 % | 1,3 % |
| 1981 | 5,7 % | 1,1 % |
| 1980 | 5,5 % | 1,1 % |
| 1979 | 5,5 % | 1,5 % |
| 1978 | 5,5 % | 1,6 % |
| 1977 | 5,5 % | 1,7 % |
| 1976 | 5,9 % | 2 % |
| 1975 | 6,3 % | 2 % |
| 1974 | 6,1 % | 1,9 % |
| 1973 | 6,2 % | 2,2 % |
| 1972 | 6,9 % | 2,4 % |
| 1971 | 6,7 % | 2,6 % |
| 1970 | 6,2 % | 2,9 % |
| 1969 | 5,5 % | 2,6 % |
| 1968 | 5,1 % | 2,6 % |
| 1967 | 5,4 % | 2,9 % |
| 1966 | 6,7 % | 3 % |
| 1965 | 5,9 % | 3,4 % |
| 1964 | 3,9 % | 2 % |
| 1963 | 3,6 % | 2,3 % |
| 1962 | 3,7 % | 2,4 % |
| 1961 | 4,1 % | 2,4 % |
| 1960 | 4,3 % | 2,7 % |
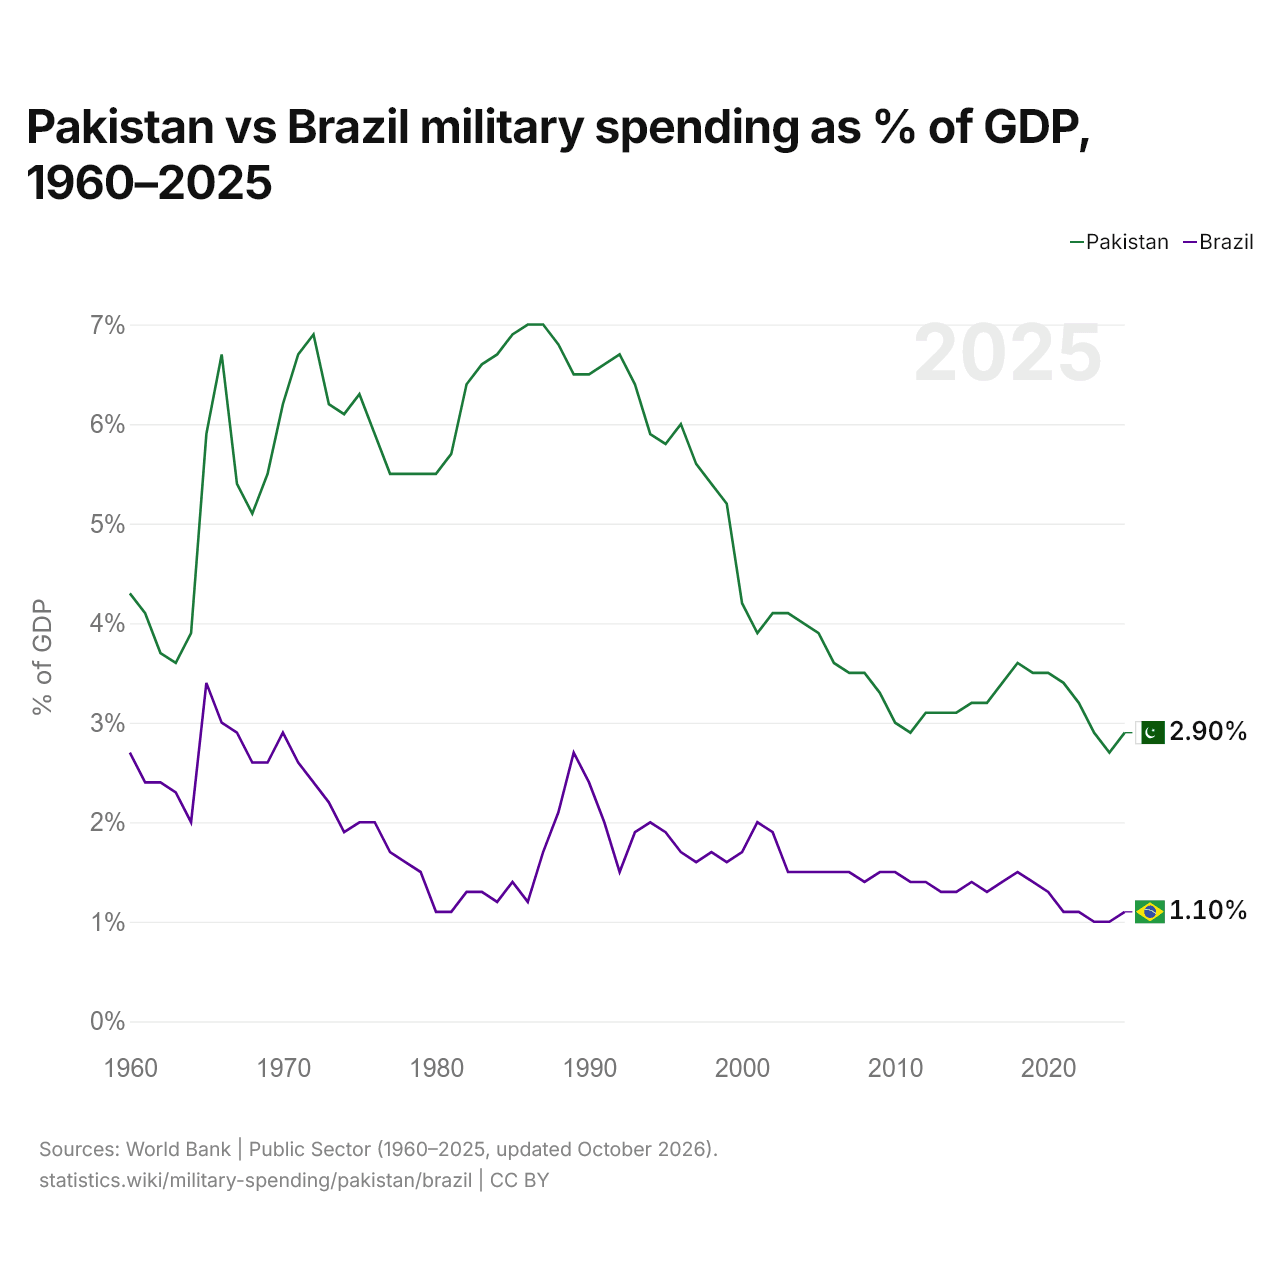
En 2025, les dépenses militaires représentaient 2,9 % du PIB au Pakistan et 1,1 % au Brésil : 1,8 points de pourcentage de plus au Pakistan. En 2015, elles représentaient 3,2 % au Pakistan et 1,4 % au Brésil, soit 1,8 points de pourcentage de plus au Pakistan.
Les dépenses militaires du Pakistan, en part du PIB, sont supérieures à celles du Brésil chaque année depuis 1960. L'écart a été le plus grand en 1986, quand les dépenses militaires du Pakistan dépassaient celles du Brésil de 5,8 points de pourcentage du PIB.
Pakistan vs Brésil : chiffres des dépenses militaires
|
Pakistan
|
Brésil
|
|
|---|---|---|
| $ US, 2025 | 11,9 Md $US | 24,0 Md $US |
| % du PIB, 2025 | 2,9 % | 1,1 % |
| Par personne, $ US | 46,5 $US | 113 $US |
| Part mondiale | 0,42 % | 0,84 % |
| Rang mondial | 31/154 | 21/154 |
Comparer les dépenses militaires de 2 pays au choix
Sources :
- Banque mondiale | Secteur public (1960–2025, mis à jour en octobre 2026)
Creative Commons Attribution (CC BY) : vous pouvez copier, partager, adapter et réutiliser ce contenu, y compris à des fins commerciales, à condition de citer statistics.wiki et d’indiquer les modifications apportées. Les sources citées ci-dessus peuvent avoir leurs propres conditions de licence.