
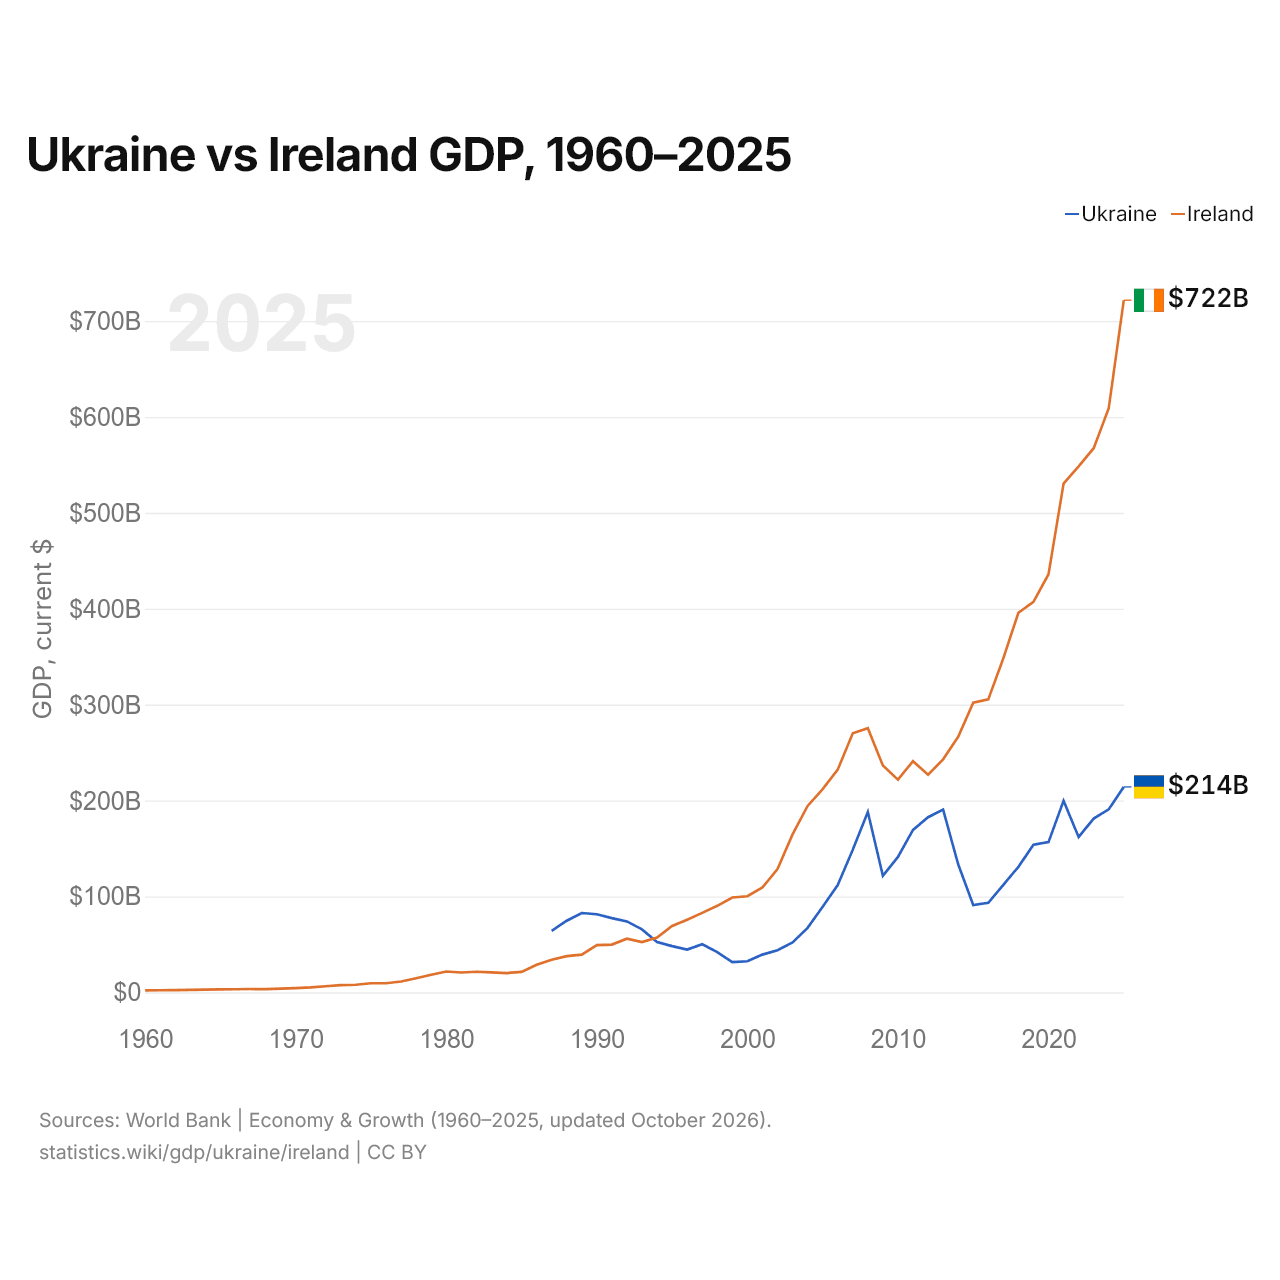
Ukraine vs Irlande : PIB, 1960–2025
| Année | PIB, dollars US courants | |
|---|---|---|
 Ukraine |
 Irlande |
|
| 2025 | 214 233 312 784 $ US | 721 701 359 046 $ US |
| 2024 | 190 833 835 445 $ US | 609 157 459 747 $ US |
| 2023 | 181 221 517 869 $ US | 567 372 737 459 $ US |
| 2022 | 161 989 520 721 $ US | 548 341 794 599 $ US |
| 2021 | 199 765 859 571 $ US | 530 394 123 830 $ US |
| 2020 | 156 617 722 013 $ US | 436 009 027 819 $ US |
| 2019 | 153 883 047 510 $ US | 407 211 793 801 $ US |
| 2018 | 130 891 088 294 $ US | 395 780 319 817 $ US |
| 2017 | 112 090 505 082 $ US | 348 355 212 569 $ US |
| 2016 | 93 355 869 404 $ US | 305 431 252 709 $ US |
| 2015 | 91 030 967 789 $ US | 302 101 388 556 $ US |
| 2014 | 133 503 871 862 $ US | 266 490 442 124 $ US |
| 2013 | 190 498 811 460 $ US | 242 924 245 719 $ US |
| 2012 | 182 591 753 828 $ US | 226 921 827 888 $ US |
| 2011 | 169 333 835 202 $ US | 240 975 871 047 $ US |
| 2010 | 141 209 170 427 $ US | 221 732 824 603 $ US |
| 2009 | 121 552 153 444 $ US | 236 443 115 854 $ US |
| 2008 | 188 110 390 660 $ US | 275 447 471 451 $ US |
| 2007 | 148 733 861 386 $ US | 270 079 279 420 $ US |
| 2006 | 111 884 752 475 $ US | 232 180 617 162 $ US |
| 2005 | 89 238 865 119 $ US | 211 876 989 656 $ US |
| 2004 | 67 220 154 164 $ US | 194 372 115 041 $ US |
| 2003 | 52 010 355 753 $ US | 164 670 771 260 $ US |
| 2002 | 43 956 163 612 $ US | 128 596 035 288 $ US |
| 2001 | 39 309 580 983 $ US | 109 346 669 230 $ US |
| 2000 | 32 375 083 935 $ US | 100 207 610 430 $ US |
| 1999 | 31 580 639 554 $ US | 98 893 958 263 $ US |
| 1998 | 41 882 523 345 $ US | 90 199 410 116 $ US |
| 1997 | 50 151 531 592 $ US | 82 856 648 758 $ US |
| 1996 | 44 558 831 005 $ US | 75 790 786 290 $ US |
| 1995 | 48 213 856 469 $ US | 69 139 823 232 $ US |
| 1994 | 52 549 580 265 $ US | 57 097 656 066 $ US |
| 1993 | 65 648 559 903 $ US | 52 417 477 614 $ US |
| 1992 | 73 945 908 384 $ US | 55 918 538 121 $ US |
| 1991 | 77 350 733 982 $ US | 49 787 501 584 $ US |
| 1990 | 81 393 558 423 $ US | 49 305 632 408 $ US |
| 1989 | 82 709 161 099 $ US | 39 238 392 678 $ US |
| 1988 | 74 703 517 903 $ US | 37 772 896 221 $ US |
| 1987 | 64 087 694 038 $ US | 33 920 518 493 $ US |
| 1986 | - | 28 714 571 852 $ US |
| 1985 | - | 21 270 013 326 $ US |
| 1984 | - | 20 106 648 455 $ US |
| 1983 | - | 20 766 047 764 $ US |
| 1982 | - | 21 474 752 962 $ US |
| 1981 | - | 20 670 190 138 $ US |
| 1980 | - | 21 747 855 640 $ US |
| 1979 | - | 18 319 334 300 $ US |
| 1978 | - | 14 647 996 074 $ US |
| 1977 | - | 11 248 340 431 $ US |
| 1976 | - | 9 453 756 015 $ US |
| 1975 | - | 9 483 808 362 $ US |
| 1974 | - | 7 896 860 615 $ US |
| 1973 | - | 7 481 173 066 $ US |
| 1972 | - | 6 318 060 582 $ US |
| 1971 | - | 5 098 250 287 $ US |
| 1970 | - | 4 395 995 086 $ US |
| 1969 | - | 3 902 721 632 $ US |
| 1968 | - | 3 378 701 147 $ US |
| 1967 | - | 3 445 739 915 $ US |
| 1966 | - | 3 198 820 904 $ US |
| 1965 | - | 3 035 655 794 $ US |
| 1964 | - | 2 851 091 646 $ US |
| 1963 | - | 2 505 073 358 $ US |
| 1962 | - | 2 329 372 972 $ US |
| 1961 | - | 2 151 772 980 $ US |
| 1960 | - | 1 998 550 222 $ US |
En 2025, le PIB de l'Irlande (722 milliards de dollars US) était 3,4 fois celui de l'Ukraine (214 milliards de dollars US). En 2015, le rapport était de 3,3. De 2015 à 2025, à prix constants de 2015, le PIB de l'Irlande a progressé de 89,6 %, tandis que celui de l'Ukraine a reculé de 11,9 %.
Depuis 1994, le PIB de l'Irlande est le plus élevé des deux ; en 1987, celui de l'Ukraine était 1,9 fois celui de l'Irlande. En 2025, le PIB par habitant était de 5 496 $ US en Ukraine et de 131 592 $ US en Irlande, soit 24 fois plus élevé en Irlande.
Ukraine vs Irlande : derniers chiffres du PIB
|
Ukraine
|
Irlande
|
|
|---|---|---|
| PIB, dollars US courants | 214 Md $US | 722 Md $US |
| Rang mondial | 57/197 | 24/197 |
| Part mondiale | 0,18 % | 0,61 % |
| PIB, dollars US constants de 2015 | 80,2 Md $US | 573 Md $US |
| Écart de PIB | 0,3× | 3,4× |
Comparer le PIB de 2 pays au choix
Sources :
- Banque mondiale | Économie et croissance (1960–2025, mis à jour en octobre 2026)
Creative Commons Attribution (CC BY) : vous pouvez copier, partager, adapter et réutiliser ce contenu, y compris à des fins commerciales, à condition de citer statistics.wiki et d’indiquer les modifications apportées. Les sources citées ci-dessus peuvent avoir leurs propres conditions de licence.