
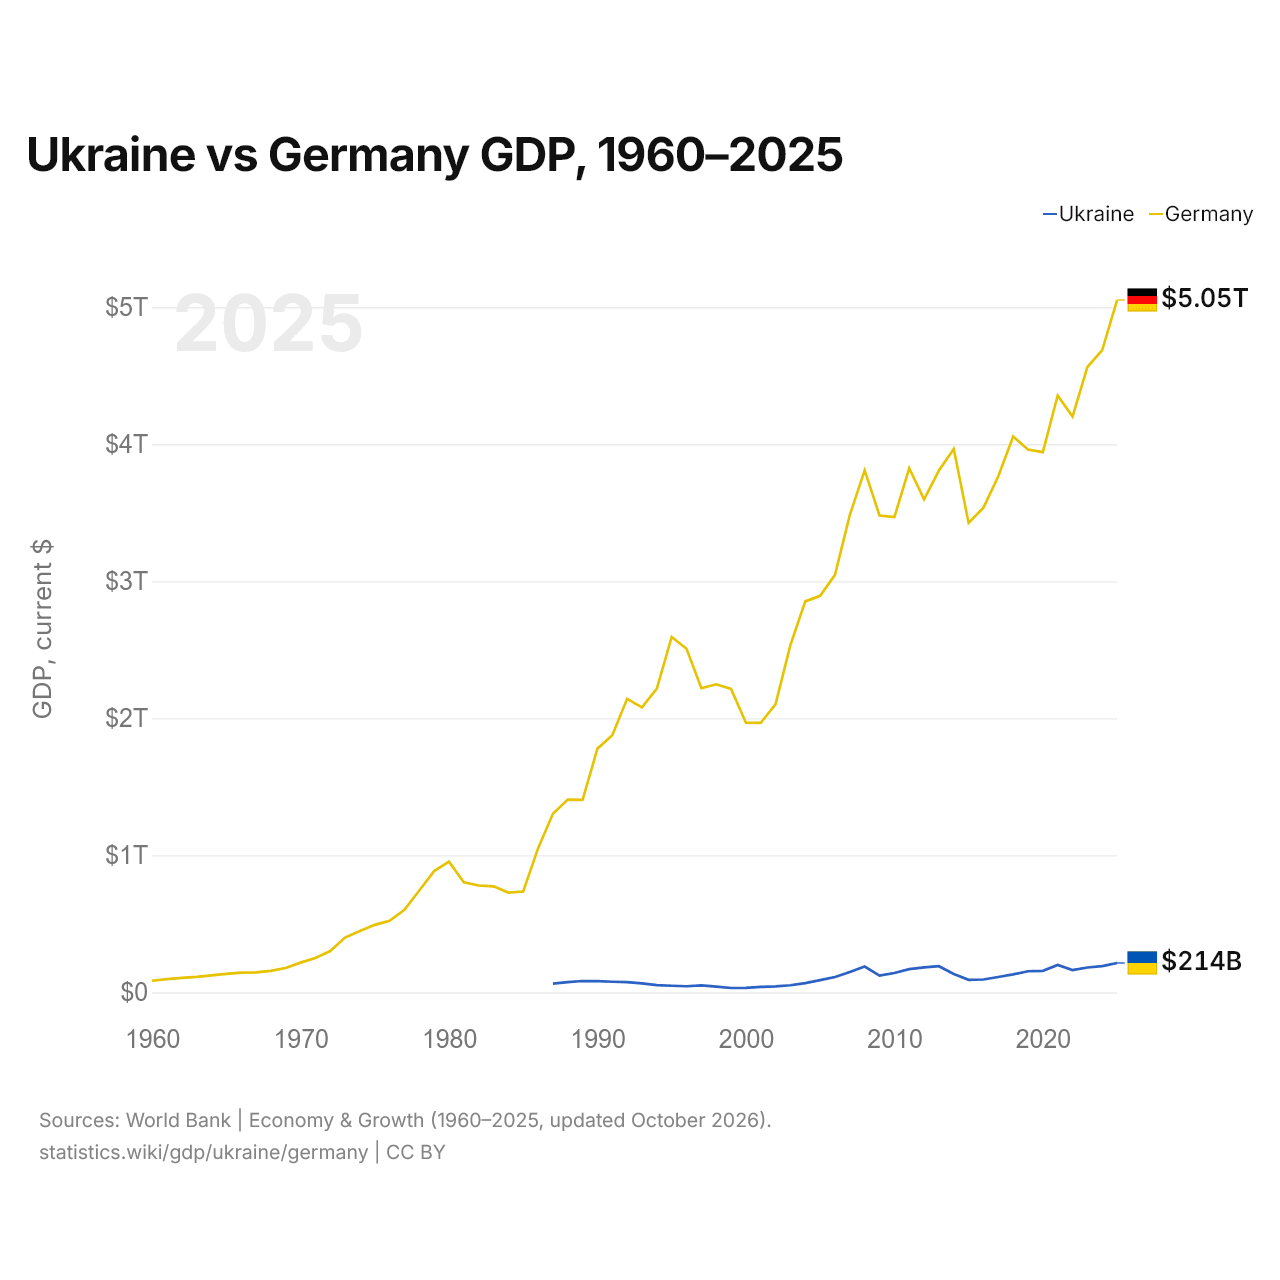
Ukraine vs Allemagne : PIB, 1960–2025
| Année | PIB, dollars US courants | |
|---|---|---|
 Ukraine |
 Allemagne |
|
| 2025 | 214 233 312 784 $ US | 5 050 922 925 047 $ US |
| 2024 | 190 833 835 445 $ US | 4 685 592 577 805 $ US |
| 2023 | 181 221 517 869 $ US | 4 562 207 532 490 $ US |
| 2022 | 161 989 520 721 $ US | 4 201 021 706 479 $ US |
| 2021 | 199 765 859 571 $ US | 4 355 251 953 411 $ US |
| 2020 | 156 617 722 013 $ US | 3 941 398 957 074 $ US |
| 2019 | 153 883 047 510 $ US | 3 959 894 794 039 $ US |
| 2018 | 130 891 088 294 $ US | 4 055 433 215 302 $ US |
| 2017 | 112 090 505 082 $ US | 3 765 351 626 106 $ US |
| 2016 | 93 355 869 404 $ US | 3 536 787 895 179 $ US |
| 2015 | 91 030 967 789 $ US | 3 425 099 578 746 $ US |
| 2014 | 133 503 871 862 $ US | 3 964 870 735 761 $ US |
| 2013 | 190 498 811 460 $ US | 3 807 023 797 051 $ US |
| 2012 | 182 591 753 828 $ US | 3 596 483 233 406 $ US |
| 2011 | 169 333 835 202 $ US | 3 823 575 803 794 $ US |
| 2010 | 141 209 170 427 $ US | 3 467 093 769 667 $ US |
| 2009 | 121 552 153 444 $ US | 3 478 545 516 684 $ US |
| 2008 | 188 110 390 660 $ US | 3 808 197 720 125 $ US |
| 2007 | 148 733 861 386 $ US | 3 484 056 680 855 $ US |
| 2006 | 111 884 752 475 $ US | 3 046 308 753 671 $ US |
| 2005 | 89 238 865 119 $ US | 2 893 393 187 362 $ US |
| 2004 | 67 220 154 164 $ US | 2 852 317 768 062 $ US |
| 2003 | 52 010 355 753 $ US | 2 534 715 518 349 $ US |
| 2002 | 43 956 163 612 $ US | 2 102 350 798 306 $ US |
| 2001 | 39 309 580 983 $ US | 1 966 381 496 642 $ US |
| 2000 | 32 375 083 935 $ US | 1 966 980 701 145 $ US |
| 1999 | 31 580 639 554 $ US | 2 213 873 468 587 $ US |
| 1998 | 41 882 523 345 $ US | 2 247 760 364 566 $ US |
| 1997 | 50 151 531 592 $ US | 2 218 790 886 533 $ US |
| 1996 | 44 558 831 005 $ US | 2 506 576 553 158 $ US |
| 1995 | 48 213 856 469 $ US | 2 593 053 091 306 $ US |
| 1994 | 52 549 580 265 $ US | 2 215 282 632 277 $ US |
| 1993 | 65 648 559 903 $ US | 2 078 954 217 438 $ US |
| 1992 | 73 945 908 384 $ US | 2 141 377 582 968 $ US |
| 1991 | 77 350 733 982 $ US | 1 875 792 575 133 $ US |
| 1990 | 81 393 558 423 $ US | 1 778 162 195 860 $ US |
| 1989 | 82 709 161 099 $ US | 1 404 092 925 205 $ US |
| 1988 | 74 703 517 903 $ US | 1 406 367 016 372 $ US |
| 1987 | 64 087 694 038 $ US | 1 302 932 318 825 $ US |
| 1986 | - | 1 050 092 624 516 $ US |
| 1985 | - | 735 218 723 093 $ US |
| 1984 | - | 727 767 760 979 $ US |
| 1983 | - | 773 507 930 295 $ US |
| 1982 | - | 779 421 633 755 $ US |
| 1981 | - | 803 404 797 058 $ US |
| 1980 | - | 953 772 499 462 $ US |
| 1979 | - | 884 574 218 333 $ US |
| 1978 | - | 743 182 891 918 $ US |
| 1977 | - | 602 698 323 086 $ US |
| 1976 | - | 521 658 712 133 $ US |
| 1975 | - | 492 434 094 920 $ US |
| 1974 | - | 446 934 971 657 $ US |
| 1973 | - | 399 833 571 167 $ US |
| 1972 | - | 300 899 944 795 $ US |
| 1971 | - | 250 900 942 397 $ US |
| 1970 | - | 216 629 229 947 $ US |
| 1969 | - | 177 733 486 326 $ US |
| 1968 | - | 156 527 292 653 $ US |
| 1967 | - | 145 100 667 773 $ US |
| 1966 | - | 143 304 275 684 $ US |
| 1965 | - | 134 774 688 191 $ US |
| 1964 | - | 123 330 404 665 $ US |
| 1963 | - | 112 232 503 744 $ US |
| 1962 | - | 105 895 435 234 $ US |
| 1961 | - | 96 558 204 043 $ US |
| 1960 | - | 84 619 845 881 $ US |
En 2025, le PIB de l'Allemagne (5,05 billions de dollars US) était 24 fois celui de l'Ukraine (214 milliards de dollars US). En 2015, le rapport était de 38. De 2015 à 2025, à prix constants de 2015, le PIB de l'Allemagne a progressé de 7,6 %, tandis que celui de l'Ukraine a reculé de 11,9 %.
Depuis 1987, le PIB de l'Allemagne a chaque année été le plus élevé des deux ; en 1987, il était 20 fois celui de l'Ukraine. En 2025, le PIB par habitant était de 5 496 $ US en Ukraine et de 60 496 $ US en Allemagne, soit 11 fois plus élevé en Allemagne.
Ukraine vs Allemagne : derniers chiffres du PIB
|
Ukraine
|
Allemagne
|
|
|---|---|---|
| PIB, dollars US courants | 214 Md $US | 5,05 Bn $US |
| Rang mondial | 57/197 | 3/197 |
| Part mondiale | 0,18 % | 4,27 % |
| PIB, dollars US constants de 2015 | 80,2 Md $US | 3,69 Bn $US |
| Écart de PIB | 0,042× | 24× |
Comparer le PIB de 2 pays au choix
Sources :
- Banque mondiale | Économie et croissance (1960–2025, mis à jour en octobre 2026)
Creative Commons Attribution (CC BY) : vous pouvez copier, partager, adapter et réutiliser ce contenu, y compris à des fins commerciales, à condition de citer statistics.wiki et d’indiquer les modifications apportées. Les sources citées ci-dessus peuvent avoir leurs propres conditions de licence.