
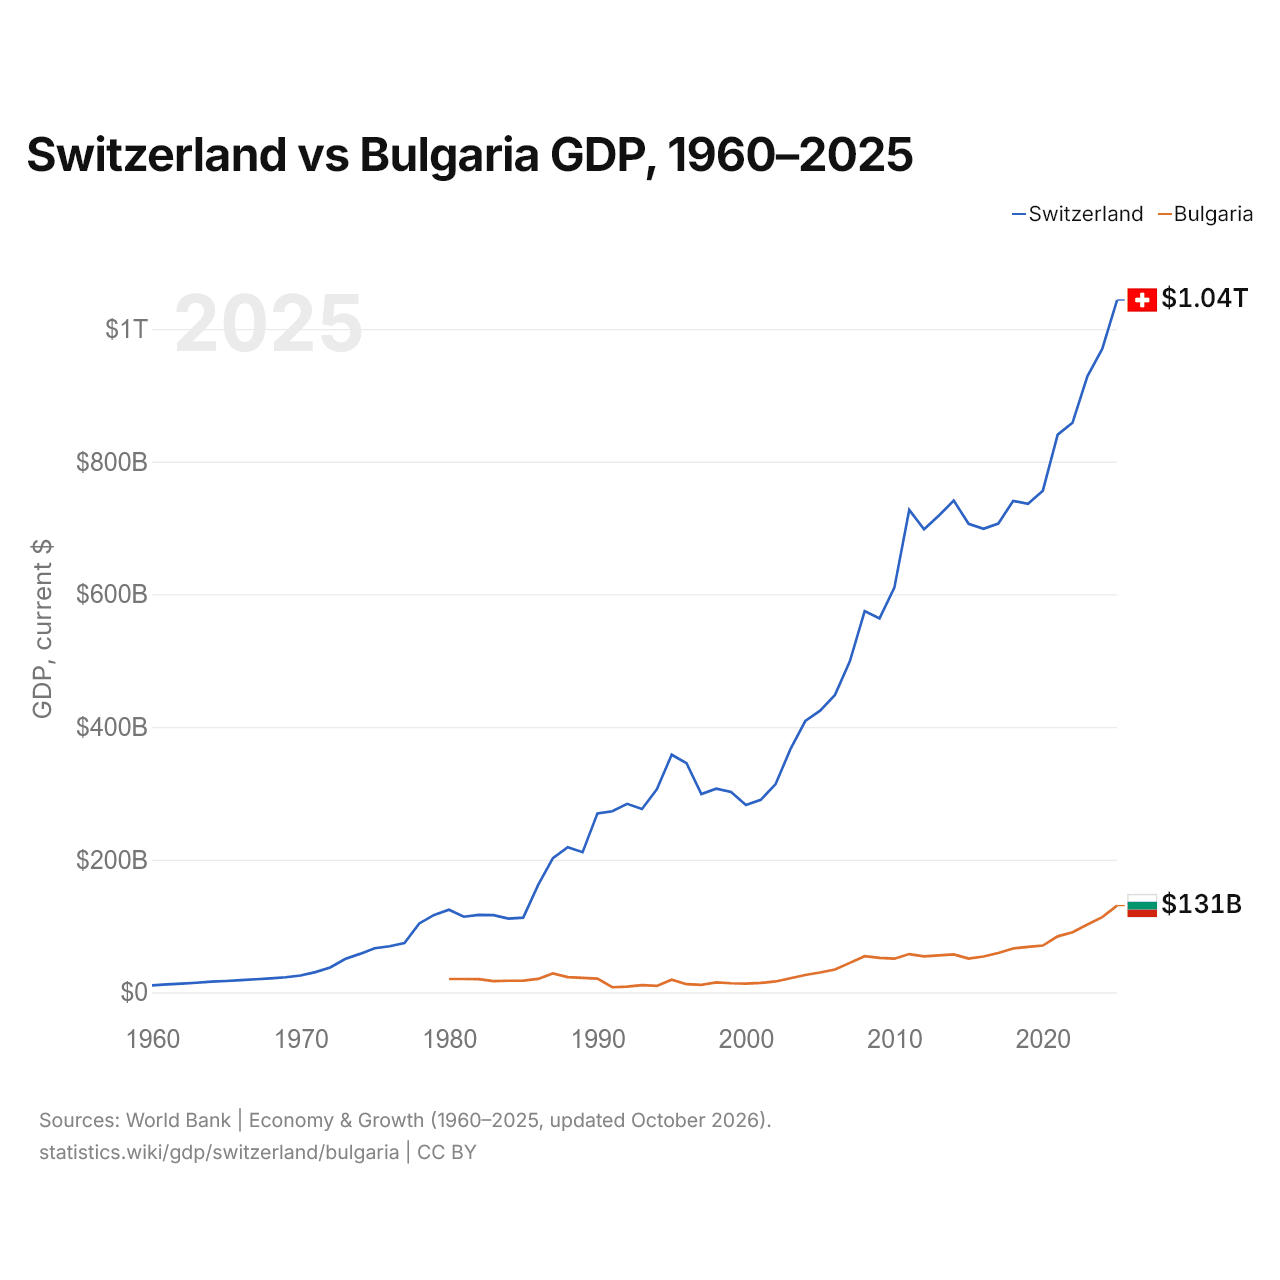
Suisse vs Bulgarie : PIB, 1960–2025
| Année | PIB, dollars US courants | |
|---|---|---|
 Suisse |
 Bulgarie |
|
| 2025 | 1 043 529 899 251 $ US | 130 777 235 530 $ US |
| 2024 | 969 919 786 395 $ US | 113 349 149 167 $ US |
| 2023 | 928 435 275 852 $ US | 102 204 457 335 $ US |
| 2022 | 858 479 038 994 $ US | 90 510 784 778 $ US |
| 2021 | 840 710 023 481 $ US | 84 378 926 047 $ US |
| 2020 | 756 096 180 222 $ US | 70 490 478 088 $ US |
| 2019 | 736 384 764 157 $ US | 68 511 235 459 $ US |
| 2018 | 740 766 531 454 $ US | 66 100 606 677 $ US |
| 2017 | 706 660 443 624 $ US | 59 170 671 046 $ US |
| 2016 | 698 607 778 795 $ US | 53 932 152 154 $ US |
| 2015 | 706 199 008 879 $ US | 50 768 512 173 $ US |
| 2014 | 741 168 119 617 $ US | 57 083 817 240 $ US |
| 2013 | 718 748 402 260 $ US | 55 822 115 861 $ US |
| 2012 | 697 882 536 677 $ US | 54 299 825 600 $ US |
| 2011 | 727 231 637 102 $ US | 57 684 243 980 $ US |
| 2010 | 609 999 593 542 $ US | 50 691 645 231 $ US |
| 2009 | 563 659 557 945 $ US | 52 026 461 290 $ US |
| 2008 | 574 703 945 157 $ US | 54 483 464 293 $ US |
| 2007 | 498 993 845 385 $ US | 44 433 521 725 $ US |
| 2006 | 448 364 681 767 $ US | 34 382 295 487 $ US |
| 2005 | 424 511 048 024 $ US | 29 870 182 425 $ US |
| 2004 | 409 012 909 530 $ US | 26 159 078 743 $ US |
| 2003 | 366 563 952 625 $ US | 21 146 038 619 $ US |
| 2002 | 313 930 961 761 $ US | 16 403 880 783 $ US |
| 2001 | 290 160 142 214 $ US | 14 184 170 319 $ US |
| 2000 | 282 327 351 966 $ US | 13 246 669 554 $ US |
| 1999 | 301 911 268 140 $ US | 13 637 793 854 $ US |
| 1998 | 306 907 741 068 $ US | 15 031 821 788 $ US |
| 1997 | 298 868 250 534 $ US | 11 316 706 412 $ US |
| 1996 | 345 373 647 249 $ US | 12 295 588 924 $ US |
| 1995 | 358 152 520 085 $ US | 18 992 388 645 $ US |
| 1994 | 305 916 331 798 $ US | 9 709 230 161 $ US |
| 1993 | 276 339 744 180 $ US | 10 832 041 595 $ US |
| 1992 | 284 139 428 246 $ US | 8 602 874 120 $ US |
| 1991 | 272 953 645 746 $ US | 7 628 764 750 $ US |
| 1990 | 269 768 238 555 $ US | 20 726 605 649 $ US |
| 1989 | 211 241 694 480 $ US | 21 746 286 447 $ US |
| 1988 | 218 788 504 066 $ US | 23 003 003 708 $ US |
| 1987 | 202 238 567 597 $ US | 28 428 718 531 $ US |
| 1986 | 161 487 171 049 $ US | 20 261 546 635 $ US |
| 1985 | 112 652 623 418 $ US | 17 562 270 447 $ US |
| 1984 | 111 104 641 869 $ US | 17 410 894 971 $ US |
| 1983 | 116 361 728 836 $ US | 16 959 180 922 $ US |
| 1982 | 116 776 899 473 $ US | 19 803 624 625 $ US |
| 1981 | 113 936 168 924 $ US | 20 055 685 481 $ US |
| 1980 | 124 404 609 417 $ US | 20 039 544 133 $ US |
| 1979 | 116 702 524 208 $ US | - |
| 1978 | 103 821 687 919 $ US | - |
| 1977 | 74 237 819 014 $ US | - |
| 1976 | 69 508 364 538 $ US | - |
| 1975 | 66 452 559 176 $ US | - |
| 1974 | 57 963 469 607 $ US | - |
| 1973 | 50 296 651 921 $ US | - |
| 1972 | 37 399 508 287 $ US | - |
| 1971 | 30 492 832 676 $ US | - |
| 1970 | 25 374 750 743 $ US | - |
| 1969 | 22 780 211 812 $ US | - |
| 1968 | 21 024 203 656 $ US | - |
| 1967 | 19 689 329 510 $ US | - |
| 1966 | 18 290 928 227 $ US | - |
| 1965 | 17 033 079 428 $ US | - |
| 1964 | 16 071 715 835 $ US | - |
| 1963 | 14 499 109 270 $ US | - |
| 1962 | 13 185 384 691 $ US | - |
| 1961 | 11 889 851 950 $ US | - |
| 1960 | 10 569 129 806 $ US | - |
En 2025, le PIB de la Suisse (1,04 billion de dollars US) était 8,0 fois celui de la Bulgarie (131 milliards de dollars US). En 2015, le rapport était de 14. De 2015 à 2025, à prix constants de 2015, le PIB de la Suisse a progressé de 20,2 % et celui de la Bulgarie de 32,5 %.
Depuis 1980, le PIB de la Suisse a chaque année été le plus élevé des deux ; en 1980, il était 6,2 fois celui de la Bulgarie. En 2025, le PIB par habitant était de 114 769 $ US en Suisse et de 20 328 $ US en Bulgarie, soit 5,6 fois plus élevé en Suisse.
Suisse vs Bulgarie : derniers chiffres du PIB
|
Suisse
|
Bulgarie
|
|
|---|---|---|
| PIB, dollars US courants | 1,04 Bn $US | 131 Md $US |
| Rang mondial | 20/197 | 63/197 |
| Part mondiale | 0,88 % | 0,11 % |
| PIB, dollars US constants de 2015 | 849 Md $US | 67,3 Md $US |
| Écart de PIB | 8× | 0,13× |
Comparer le PIB de 2 pays au choix
Sources :
- Banque mondiale | Économie et croissance (1960–2025, mis à jour en octobre 2026)
Creative Commons Attribution (CC BY) : vous pouvez copier, partager, adapter et réutiliser ce contenu, y compris à des fins commerciales, à condition de citer statistics.wiki et d’indiquer les modifications apportées. Les sources citées ci-dessus peuvent avoir leurs propres conditions de licence.