
Bulgarie vs Algérie : PIB, 1960–2025
| Année | PIB, dollars US courants | |
|---|---|---|
 Bulgarie |
 Algérie |
|
| 2025 | 130 777 235 530 $ US | 287 031 225 988 $ US |
| 2024 | 113 349 149 167 $ US | 269 322 281 665 $ US |
| 2023 | 102 204 457 335 $ US | 247 923 887 215 $ US |
| 2022 | 90 510 784 778 $ US | 225 581 644 703 $ US |
| 2021 | 84 378 926 047 $ US | 186 231 205 262 $ US |
| 2020 | 70 490 478 088 $ US | 164 873 415 325 $ US |
| 2019 | 68 511 235 459 $ US | 193 459 662 091 $ US |
| 2018 | 66 100 606 677 $ US | 194 554 483 656 $ US |
| 2017 | 59 170 671 046 $ US | 189 880 896 903 $ US |
| 2016 | 53 932 152 154 $ US | 180 763 839 522 $ US |
| 2015 | 50 768 512 173 $ US | 187 493 855 609 $ US |
| 2014 | 57 083 817 240 $ US | 238 942 664 193 $ US |
| 2013 | 55 822 115 861 $ US | 229 701 430 292 $ US |
| 2012 | 54 299 825 600 $ US | 227 143 746 076 $ US |
| 2011 | 57 684 243 980 $ US | 218 331 946 925 $ US |
| 2010 | 50 691 645 231 $ US | 177 785 053 940 $ US |
| 2009 | 52 026 461 290 $ US | 150 317 292 079 $ US |
| 2008 | 54 483 464 293 $ US | 180 383 848 331 $ US |
| 2007 | 44 433 521 725 $ US | 142 482 739 810 $ US |
| 2006 | 34 382 295 487 $ US | 123 084 258 693 $ US |
| 2005 | 29 870 182 425 $ US | 107 046 618 670 $ US |
| 2004 | 26 159 078 743 $ US | 91 913 680 985 $ US |
| 2003 | 21 146 038 619 $ US | 73 482 264 191 $ US |
| 2002 | 16 403 880 783 $ US | 61 516 103 406 $ US |
| 2001 | 14 184 170 319 $ US | 59 413 400 924 $ US |
| 2000 | 13 246 669 554 $ US | 54 790 398 570 $ US |
| 1999 | 13 637 793 854 $ US | 48 640 671 735 $ US |
| 1998 | 15 031 821 788 $ US | 48 187 781 984 $ US |
| 1997 | 11 316 706 412 $ US | 48 177 612 042 $ US |
| 1996 | 12 295 588 924 $ US | 46 941 554 225 $ US |
| 1995 | 18 992 388 645 $ US | 41 764 291 672 $ US |
| 1994 | 9 709 230 161 $ US | 42 543 176 829 $ US |
| 1993 | 10 832 041 595 $ US | 49 945 584 453 $ US |
| 1992 | 8 602 874 120 $ US | 48 003 133 347 $ US |
| 1991 | 7 628 764 750 $ US | 45 715 676 428 $ US |
| 1990 | 20 726 605 649 $ US | 62 048 507 531 $ US |
| 1989 | 21 746 286 447 $ US | 55 634 721 573 $ US |
| 1988 | 23 003 003 708 $ US | 59 089 396 860 $ US |
| 1987 | 28 428 718 531 $ US | 66 745 818 375 $ US |
| 1986 | 20 261 546 635 $ US | 63 692 007 897 $ US |
| 1985 | 17 562 270 447 $ US | 57 937 868 670 $ US |
| 1984 | 17 410 894 971 $ US | 53 698 548 293 $ US |
| 1983 | 16 959 180 922 $ US | 48 801 369 800 $ US |
| 1982 | 19 803 624 625 $ US | 45 207 167 470 $ US |
| 1981 | 20 055 685 481 $ US | 44 348 590 461 $ US |
| 1980 | 20 039 544 133 $ US | 42 345 829 079 $ US |
| 1979 | - | 33 243 706 860 $ US |
| 1978 | - | 26 364 491 313 $ US |
| 1977 | - | 20 972 113 685 $ US |
| 1976 | - | 17 728 240 932 $ US |
| 1975 | - | 15 557 902 754 $ US |
| 1974 | - | 13 209 871 626 $ US |
| 1973 | - | 8 707 858 912 $ US |
| 1972 | - | 6 766 743 957 $ US |
| 1971 | - | 5 077 183 094 $ US |
| 1970 | - | 4 863 526 897 $ US |
| 1969 | - | 4 257 253 264 $ US |
| 1968 | - | 3 852 147 027 $ US |
| 1967 | - | 3 370 870 376 $ US |
| 1966 | - | 3 039 859 187 $ US |
| 1965 | - | 3 136 284 307 $ US |
| 1964 | - | 2 909 316 435 $ US |
| 1963 | - | 2 702 982 018 $ US |
| 1962 | - | 2 001 444 544 $ US |
| 1961 | - | 2 434 747 056 $ US |
| 1960 | - | 2 723 615 451 $ US |
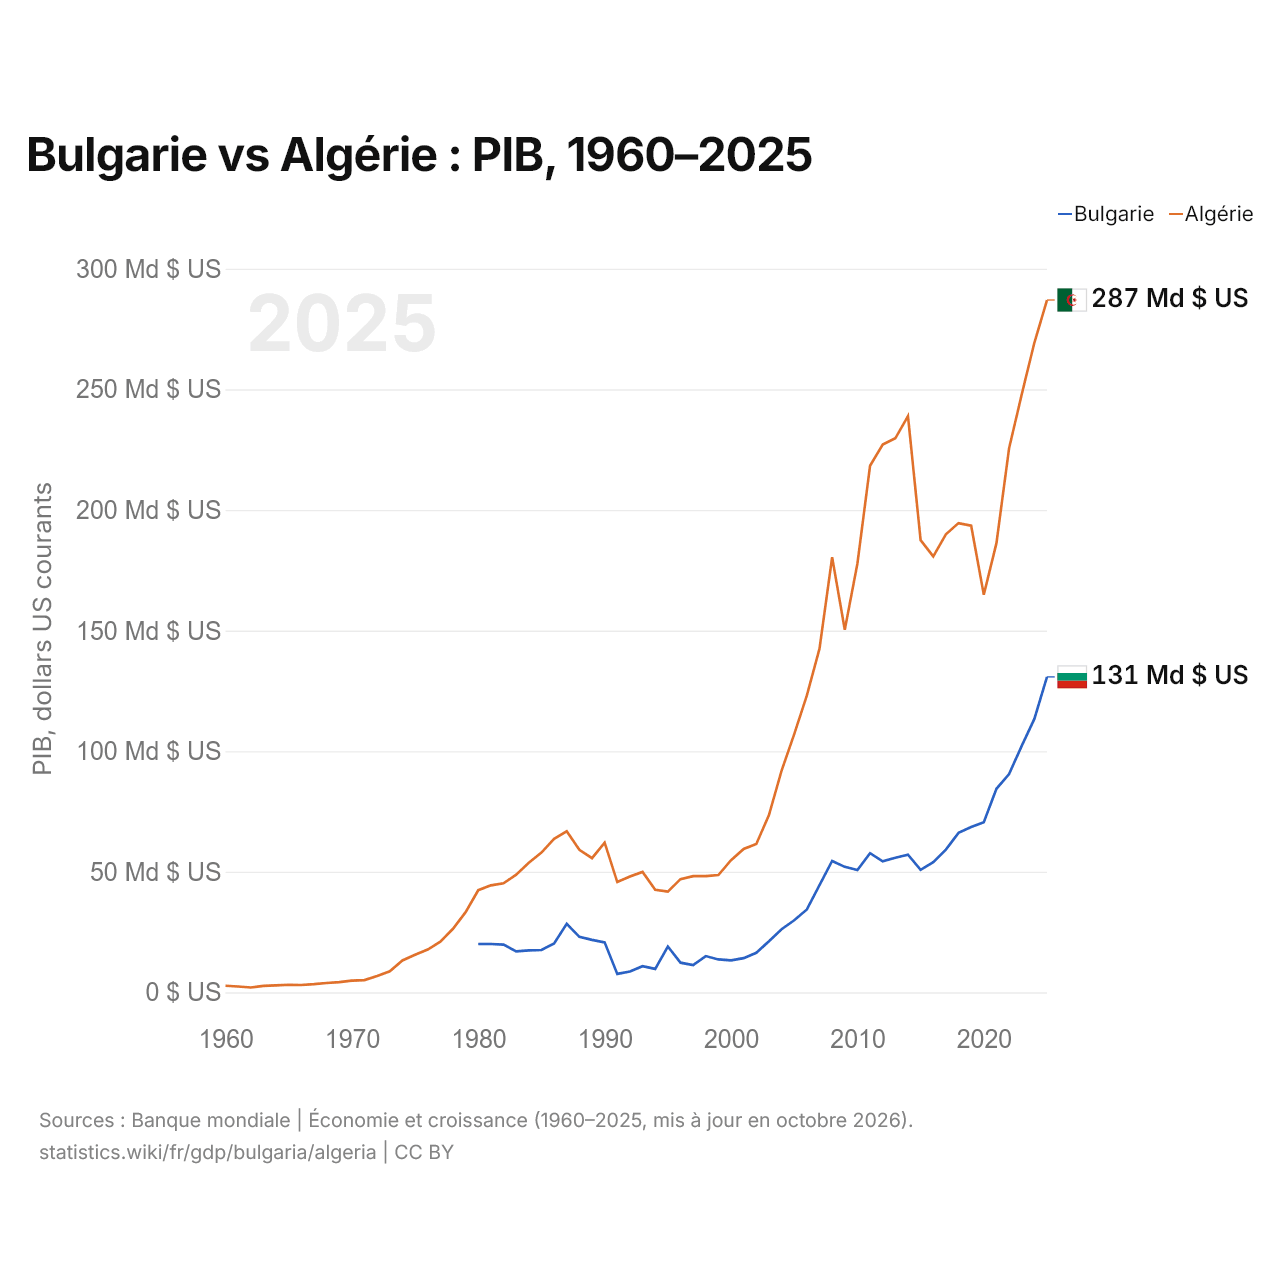
En 2025, le PIB de l'Algérie (287 milliards de dollars US) était 2,2 fois celui de la Bulgarie (131 milliards de dollars US). En 2015, le rapport était de 3,7. De 2015 à 2025, à prix constants de 2015, le PIB de l'Algérie a progressé de 23,5 % et celui de la Bulgarie de 32,5 %.
Depuis 1980, le PIB de l'Algérie a chaque année été le plus élevé des deux ; en 1980, il était 2,1 fois celui de la Bulgarie. En 2025, le PIB par habitant était de 20 328 $ US en Bulgarie et de 6 051 $ US en Algérie, soit 3,4 fois plus élevé en Bulgarie.
Bulgarie vs Algérie : derniers chiffres du PIB
|
Bulgarie
|
Algérie
|
|
|---|---|---|
| PIB, dollars US courants | 131 Md $US | 287 Md $US |
| Rang mondial | 63/197 | 51/197 |
| Part mondiale | 0,11 % | 0,24 % |
| PIB, dollars US constants de 2015 | 67,3 Md $US | 232 Md $US |
| Écart de PIB | 0,46× | 2,2× |
Comparer le PIB de 2 pays au choix
Sources :
- Banque mondiale | Économie et croissance (1960–2025, mis à jour en octobre 2026)
Creative Commons Attribution (CC BY) : vous pouvez copier, partager, adapter et réutiliser ce contenu, y compris à des fins commerciales, à condition de citer statistics.wiki et d’indiquer les modifications apportées. Les sources citées ci-dessus peuvent avoir leurs propres conditions de licence.