
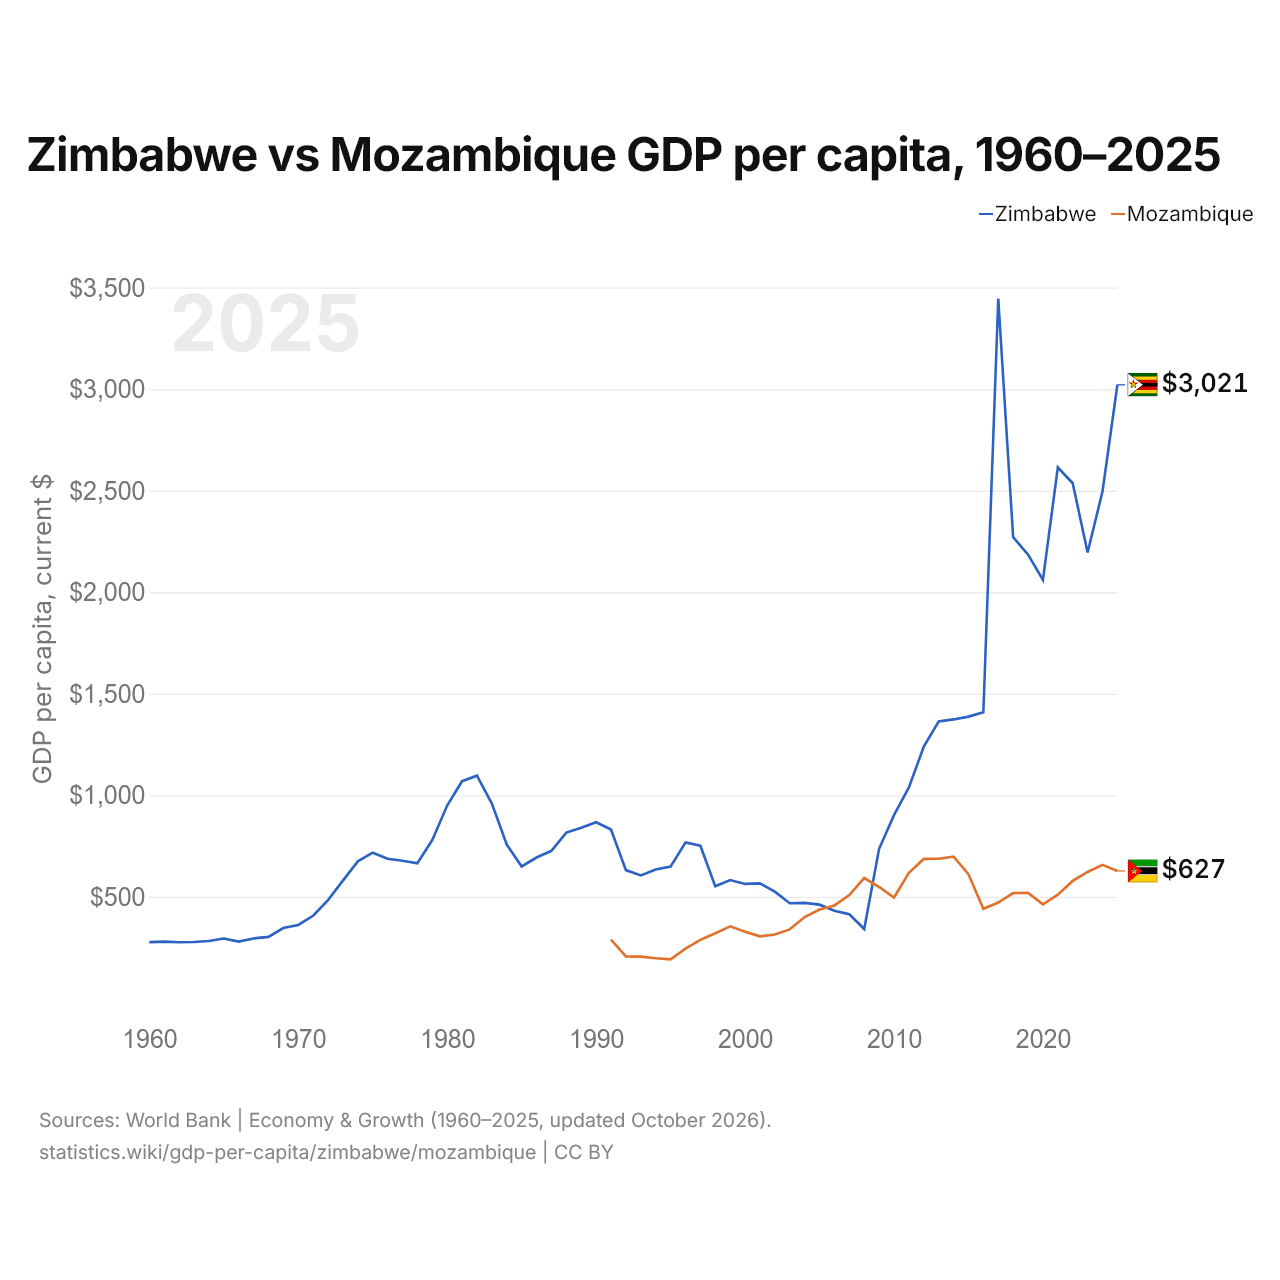
Zimbabwe vs Mozambique : PIB par habitant, 1960–2025
| Année | PIB par habitant, dollars US courants | |
|---|---|---|
 Zimbabwe |
 Mozambique |
|
| 2025 | 3 021 $ US | 627 $ US |
| 2024 | 2 496 $ US | 657 $ US |
| 2023 | 2 195 $ US | 622 $ US |
| 2022 | 2 536 $ US | 578 $ US |
| 2021 | 2 614 $ US | 510 $ US |
| 2020 | 2 060 $ US | 462 $ US |
| 2019 | 2 185 $ US | 519 $ US |
| 2018 | 2 271 $ US | 518 $ US |
| 2017 | 3 445 $ US | 471 $ US |
| 2016 | 1 408 $ US | 441 $ US |
| 2015 | 1 387 $ US | 611 $ US |
| 2014 | 1 373 $ US | 697 $ US |
| 2013 | 1 363 $ US | 687 $ US |
| 2012 | 1 239 $ US | 686 $ US |
| 2011 | 1 038 $ US | 618 $ US |
| 2010 | 902 $ US | 496 $ US |
| 2009 | 736 $ US | 548 $ US |
| 2008 | 341 $ US | 592 $ US |
| 2007 | 414 $ US | 508 $ US |
| 2006 | 431 $ US | 457 $ US |
| 2005 | 461 $ US | 437 $ US |
| 2004 | 470 $ US | 400 $ US |
| 2003 | 468 $ US | 339 $ US |
| 2002 | 525 $ US | 314 $ US |
| 2001 | 566 $ US | 305 $ US |
| 2000 | 563 $ US | 327 $ US |
| 1999 | 582 $ US | 354 $ US |
| 1998 | 552 $ US | 320 $ US |
| 1997 | 751 $ US | 287,5 $ US |
| 1996 | 767 $ US | 244,4 $ US |
| 1995 | 648 $ US | 191,8 $ US |
| 1994 | 634 $ US | 196,8 $ US |
| 1993 | 605 $ US | 205,2 $ US |
| 1992 | 631 $ US | 205,6 $ US |
| 1991 | 831 $ US | 288,7 $ US |
| 1990 | 867 $ US | - |
| 1989 | 840 $ US | - |
| 1988 | 816 $ US | - |
| 1987 | 726 $ US | - |
| 1986 | 693 $ US | - |
| 1985 | 649 $ US | - |
| 1984 | 757 $ US | - |
| 1983 | 959 $ US | - |
| 1982 | 1 096 $ US | - |
| 1981 | 1 069 $ US | - |
| 1980 | 949 $ US | - |
| 1979 | 779 $ US | - |
| 1978 | 665 $ US | - |
| 1977 | 677 $ US | - |
| 1976 | 687 $ US | - |
| 1975 | 717 $ US | - |
| 1974 | 674 $ US | - |
| 1973 | 579 $ US | - |
| 1972 | 483 $ US | - |
| 1971 | 406 $ US | - |
| 1970 | 361 $ US | - |
| 1969 | 346 $ US | - |
| 1968 | 302 $ US | - |
| 1967 | 294,4 $ US | - |
| 1966 | 278,7 $ US | - |
| 1965 | 294,3 $ US | - |
| 1964 | 281,9 $ US | - |
| 1963 | 277,1 $ US | - |
| 1962 | 275,7 $ US | - |
| 1961 | 279,2 $ US | - |
| 1960 | 276,6 $ US | - |
En 2025, le PIB par habitant était de 3 021 $ US au Zimbabwe et de 627 $ US au Mozambique : 4,8 fois plus élevé au Zimbabwe. En 1991, il était de 831 $ US au Zimbabwe et de 289 $ US au Mozambique, soit 2,9 fois plus au Zimbabwe.
Le PIB par habitant du Zimbabwe est plus élevé que celui du Mozambique chaque année depuis 2009. À prix constants de 2015, entre 1980 et 2025, le PIB par habitant du Zimbabwe a reculé de 3 %, et celui du Mozambique a progressé de 133 %.
Zimbabwe vs Mozambique : derniers chiffres du PIB par habitant
|
Zimbabwe
|
Mozambique
|
|
|---|---|---|
| PIB par habitant, dollars US courants | 3 021 $US | 627 $US |
| Rang mondial | 146/197 | 193/197 |
| PIB par habitant, dollars US constants de 2015 | 1 503 $US | 586 $US |
| × moyenne mondiale | 0,21× | 0,04× |
| Écart de PIB par habitant | 4,8× | 0,21× |
Comparer le PIB par habitant de 2 pays au choix
Sources :
- Banque mondiale | Économie et croissance (1960–2025, mis à jour en octobre 2026)
Creative Commons Attribution (CC BY) : vous pouvez copier, partager, adapter et réutiliser ce contenu, y compris à des fins commerciales, à condition de citer statistics.wiki et d’indiquer les modifications apportées. Les sources citées ci-dessus peuvent avoir leurs propres conditions de licence.