
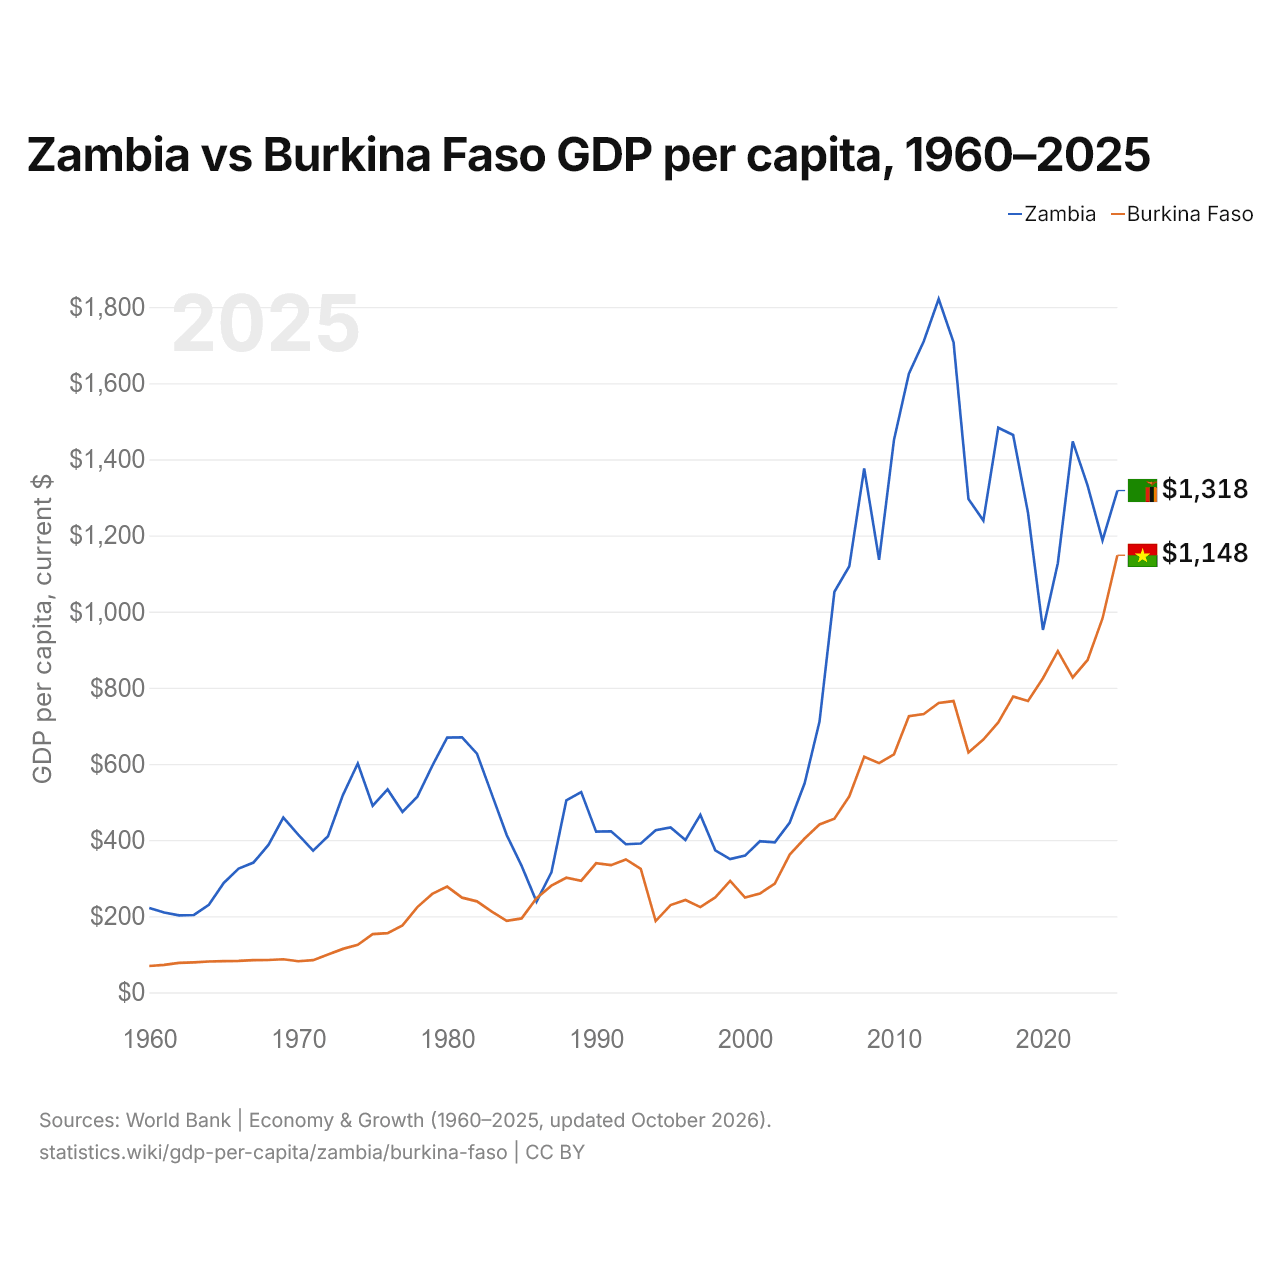
Zambie vs Burkina Faso : PIB par habitant, 1960–2025
| Année | PIB par habitant, dollars US courants | |
|---|---|---|
 Zambie |
 Burkina Faso |
|
| 2025 | 1 318 $ US | 1 148 $ US |
| 2024 | 1 187 $ US | 982 $ US |
| 2023 | 1 331 $ US | 873 $ US |
| 2022 | 1 447 $ US | 827 $ US |
| 2021 | 1 127 $ US | 896 $ US |
| 2020 | 952 $ US | 825 $ US |
| 2019 | 1 259 $ US | 765 $ US |
| 2018 | 1 464 $ US | 777 $ US |
| 2017 | 1 483 $ US | 709 $ US |
| 2016 | 1 239 $ US | 664 $ US |
| 2015 | 1 296 $ US | 630 $ US |
| 2014 | 1 707 $ US | 765 $ US |
| 2013 | 1 821 $ US | 760 $ US |
| 2012 | 1 710 $ US | 731 $ US |
| 2011 | 1 625 $ US | 725 $ US |
| 2010 | 1 451 $ US | 625 $ US |
| 2009 | 1 136 $ US | 602 $ US |
| 2008 | 1 376 $ US | 619 $ US |
| 2007 | 1 119 $ US | 515 $ US |
| 2006 | 1 052 $ US | 456 $ US |
| 2005 | 711 $ US | 441 $ US |
| 2004 | 549 $ US | 404 $ US |
| 2003 | 446 $ US | 362 $ US |
| 2002 | 394 $ US | 285,7 $ US |
| 2001 | 397 $ US | 259,5 $ US |
| 2000 | 359 $ US | 248,9 $ US |
| 1999 | 350 $ US | 292,8 $ US |
| 1998 | 373 $ US | 249,5 $ US |
| 1997 | 466 $ US | 223,9 $ US |
| 1996 | 400 $ US | 242,7 $ US |
| 1995 | 433 $ US | 229,1 $ US |
| 1994 | 426 $ US | 187,2 $ US |
| 1993 | 391 $ US | 324 $ US |
| 1992 | 389 $ US | 349 $ US |
| 1991 | 423 $ US | 334 $ US |
| 1990 | 422 $ US | 339 $ US |
| 1989 | 526 $ US | 293,2 $ US |
| 1988 | 504 $ US | 301 $ US |
| 1987 | 315 $ US | 280,2 $ US |
| 1986 | 238,2 $ US | 247,5 $ US |
| 1985 | 332 $ US | 194,1 $ US |
| 1984 | 413 $ US | 187,8 $ US |
| 1983 | 520 $ US | 211,9 $ US |
| 1982 | 627 $ US | 239 $ US |
| 1981 | 670 $ US | 248,7 $ US |
| 1980 | 669 $ US | 277,6 $ US |
| 1979 | 595 $ US | 258,5 $ US |
| 1978 | 514 $ US | 223,9 $ US |
| 1977 | 474 $ US | 176 $ US |
| 1976 | 533 $ US | 155,5 $ US |
| 1975 | 490 $ US | 152,9 $ US |
| 1974 | 601 $ US | 124,7 $ US |
| 1973 | 518 $ US | 114,1 $ US |
| 1972 | 410 $ US | 99,6 $ US |
| 1971 | 372 $ US | 84,5 $ US |
| 1970 | 414 $ US | 81,7 $ US |
| 1969 | 459 $ US | 86,8 $ US |
| 1968 | 387 $ US | 85 $ US |
| 1967 | 341 $ US | 84,6 $ US |
| 1966 | 325 $ US | 82,8 $ US |
| 1965 | 287,4 $ US | 82,1 $ US |
| 1964 | 230 $ US | 80,9 $ US |
| 1963 | 203,2 $ US | 78,9 $ US |
| 1962 | 202,3 $ US | 77,2 $ US |
| 1961 | 209,7 $ US | 72,2 $ US |
| 1960 | 221,6 $ US | 69,2 $ US |
En 2025, le PIB par habitant était de 1 318 $ US en Zambie et de 1 148 $ US au Burkina Faso : 15 % de plus en Zambie. En 1960, il était de 222 $ US en Zambie et de 69 $ US au Burkina Faso, soit 3,2 fois plus en Zambie.
Le PIB par habitant de la Zambie est plus élevé que celui du Burkina Faso chaque année depuis 1987. À prix constants de 2015, entre 1960 et 2025, le PIB par habitant de la Zambie a progressé de 14 %, et celui du Burkina Faso a progressé de 222 %.
Zambie vs Burkina Faso : derniers chiffres du PIB par habitant
|
Zambie
|
Burkina Faso
|
|
|---|---|---|
| PIB par habitant, dollars US courants | 1 318 $US | 1 148 $US |
| Rang mondial | 170/197 | 176/197 |
| PIB par habitant, dollars US constants de 2015 | 1 356 $US | 787 $US |
| × moyenne mondiale | 0,09× | 0,08× |
| Écart de PIB par habitant | 1,1× | 0,87× |
Comparer le PIB par habitant de 2 pays au choix
Sources :
- Banque mondiale | Économie et croissance (1960–2025, mis à jour en octobre 2026)
Creative Commons Attribution (CC BY) : vous pouvez copier, partager, adapter et réutiliser ce contenu, y compris à des fins commerciales, à condition de citer statistics.wiki et d’indiquer les modifications apportées. Les sources citées ci-dessus peuvent avoir leurs propres conditions de licence.