
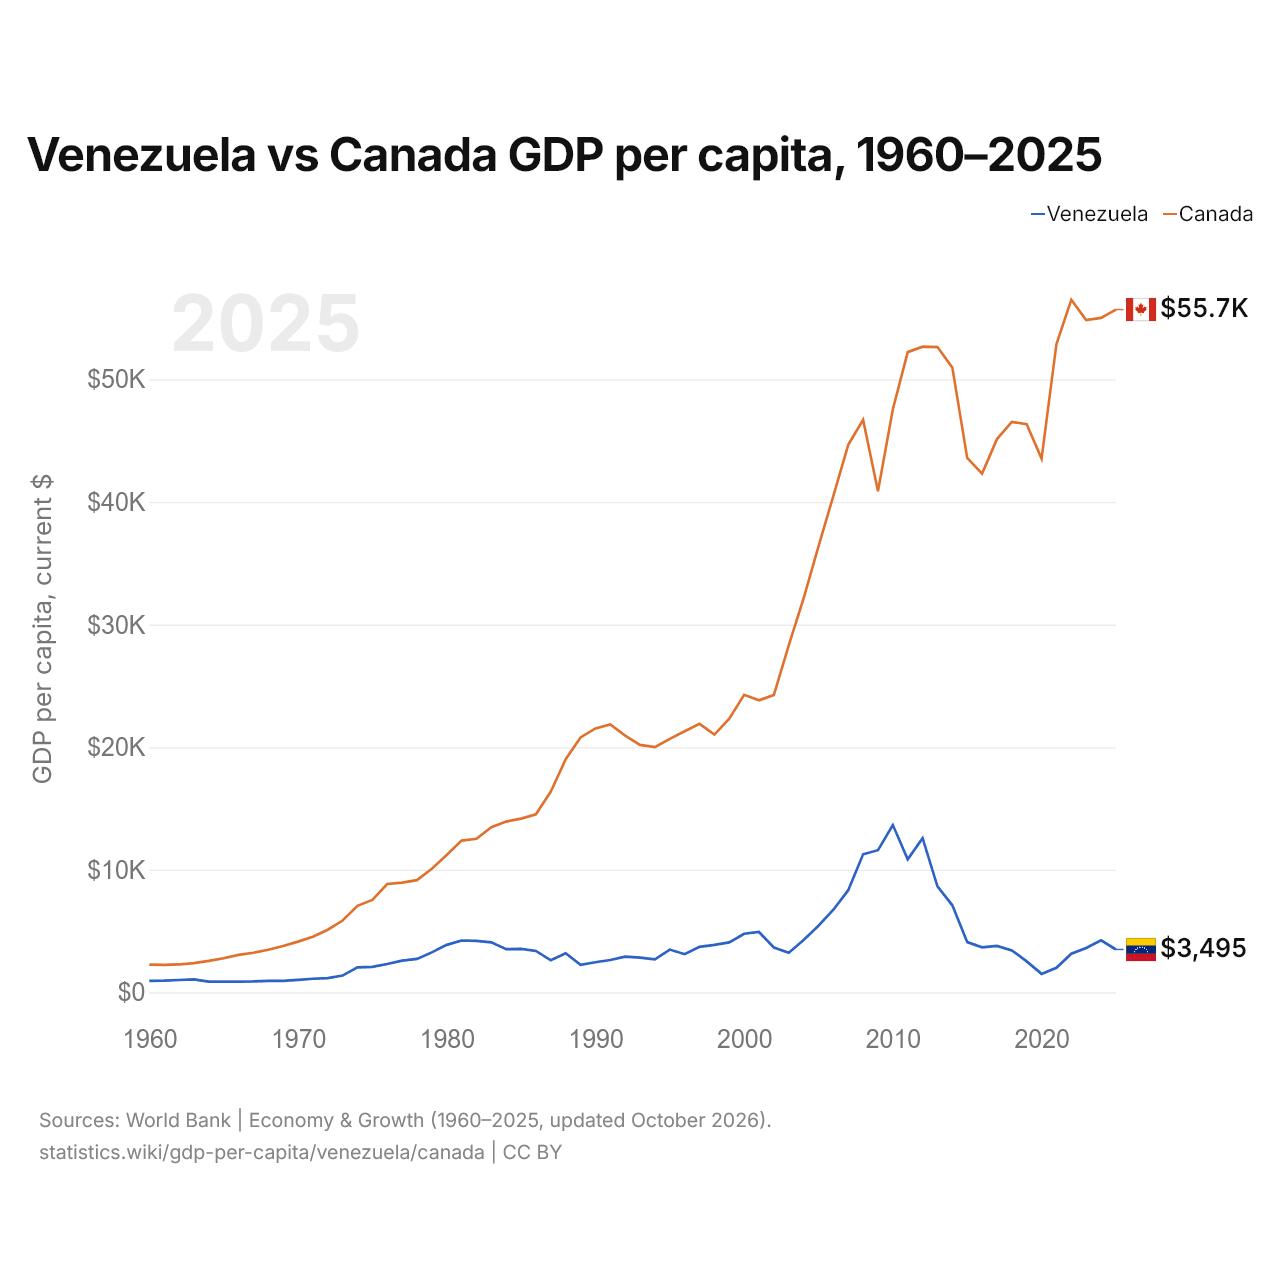
Venezuela vs Canada : PIB par habitant, 1960–2025
| Année | PIB par habitant, dollars US courants | |
|---|---|---|
 Venezuela |
 Canada |
|
| 2025 | 3 495 $ US | 55 698 $ US |
| 2024 | 4 244 $ US | 55 016 $ US |
| 2023 | 3 617 $ US | 54 848 $ US |
| 2022 | 3 155 $ US | 56 497 $ US |
| 2021 | 2 005 $ US | 52 887 $ US |
| 2020 | 1 506 $ US | 43 538 $ US |
| 2019 | 2 523 $ US | 46 353 $ US |
| 2018 | 3 422 $ US | 46 539 $ US |
| 2017 | 3 792 $ US | 45 130 $ US |
| 2016 | 3 671 $ US | 42 314 $ US |
| 2015 | 4 097 $ US | 43 594 $ US |
| 2014 | 7 101 $ US | 50 961 $ US |
| 2013 | 8 642 $ US | 52 638 $ US |
| 2012 | 12 582 $ US | 52 670 $ US |
| 2011 | 10 844 $ US | 52 224 $ US |
| 2010 | 13 646 $ US | 47 561 $ US |
| 2009 | 11 597 $ US | 40 875 $ US |
| 2008 | 11 262 $ US | 46 710 $ US |
| 2007 | 8 332 $ US | 44 660 $ US |
| 2006 | 6 739 $ US | 40 505 $ US |
| 2005 | 5 432 $ US | 36 384 $ US |
| 2004 | 4 269 $ US | 32 146 $ US |
| 2003 | 3 230 $ US | 28 302 $ US |
| 2002 | 3 652 $ US | 24 256 $ US |
| 2001 | 4 920 $ US | 23 822 $ US |
| 2000 | 4 776 $ US | 24 271 $ US |
| 1999 | 4 071 $ US | 22 315 $ US |
| 1998 | 3 870 $ US | 21 025 $ US |
| 1997 | 3 711 $ US | 21 902 $ US |
| 1996 | 3 113 $ US | 21 297 $ US |
| 1995 | 3 487 $ US | 20 680 $ US |
| 1994 | 2 689 $ US | 19 998 $ US |
| 1993 | 2 825 $ US | 20 187 $ US |
| 1992 | 2 907 $ US | 20 950 $ US |
| 1991 | 2 633 $ US | 21 847 $ US |
| 1990 | 2 452 $ US | 21 526 $ US |
| 1989 | 2 250 $ US | 20 795 $ US |
| 1988 | 3 191 $ US | 19 013 $ US |
| 1987 | 2 611 $ US | 16 378 $ US |
| 1986 | 3 376 $ US | 14 521 $ US |
| 1985 | 3 549 $ US | 14 170 $ US |
| 1984 | 3 520 $ US | 13 930 $ US |
| 1983 | 4 079 $ US | 13 477 $ US |
| 1982 | 4 202 $ US | 12 527 $ US |
| 1981 | 4 228 $ US | 12 379 $ US |
| 1980 | 3 874 $ US | 11 208 $ US |
| 1979 | 3 257 $ US | 10 078 $ US |
| 1978 | 2 727 $ US | 9 154 $ US |
| 1977 | 2 585 $ US | 8 949 $ US |
| 1976 | 2 309 $ US | 8 839 $ US |
| 1975 | 2 078 $ US | 7 537 $ US |
| 1974 | 2 034 $ US | 7 057 $ US |
| 1973 | 1 367 $ US | 5 858 $ US |
| 1972 | 1 155 $ US | 5 107 $ US |
| 1971 | 1 106 $ US | 4 535 $ US |
| 1970 | 1 015 $ US | 4 136 $ US |
| 1969 | 932 $ US | 3 776 $ US |
| 1968 | 938 $ US | 3 473 $ US |
| 1967 | 893 $ US | 3 226 $ US |
| 1966 | 876 $ US | 3 055 $ US |
| 1965 | 869 $ US | 2 777 $ US |
| 1964 | 874 $ US | 2 562 $ US |
| 1963 | 1 060 $ US | 2 380 $ US |
| 1962 | 1 007 $ US | 2 274 $ US |
| 1961 | 954 $ US | 2 246 $ US |
| 1960 | 939 $ US | 2 265 $ US |
En 2025, le PIB par habitant était de 3 495 $ US au Venezuela et de 55 698 $ US au Canada : 16 fois plus élevé au Canada. En 1960, il était de 939 $ US au Venezuela et de 2 265 $ US au Canada, soit 2,4 fois plus au Canada.
Le PIB par habitant du Canada est plus élevé que celui du Venezuela chaque année depuis 1960. À prix constants de 2015, entre 1960 et 2025, le PIB par habitant du Venezuela a reculé de 63 %, et celui du Canada a progressé de 194 %.
Venezuela vs Canada : derniers chiffres du PIB par habitant
|
Venezuela
|
Canada
|
|
|---|---|---|
| PIB par habitant, dollars US courants | 3 495 $US | 55 698 $US |
| Rang mondial | 138/197 | 23/197 |
| PIB par habitant, dollars US constants de 2015 | 1 519 $US | 45 418 $US |
| × moyenne mondiale | 0,24× | 3,87× |
| Écart de PIB par habitant | 0,063× | 16× |
Comparer le PIB par habitant de 2 pays au choix
Sources :
- Banque mondiale | Économie et croissance (1960–2025, mis à jour en octobre 2026)
Creative Commons Attribution (CC BY) : vous pouvez copier, partager, adapter et réutiliser ce contenu, y compris à des fins commerciales, à condition de citer statistics.wiki et d’indiquer les modifications apportées. Les sources citées ci-dessus peuvent avoir leurs propres conditions de licence.