
Turquie vs Iran : PIB par habitant, 1960–2025
| Année | PIB par habitant, dollars US courants | |
|---|---|---|
 Turquie |
 Iran |
|
| 2025 | 18 599 $ US | 3 924 $ US |
| 2024 | 15 893 $ US | 5 190 $ US |
| 2023 | 13 375 $ US | 5 049 $ US |
| 2022 | 10 898 $ US | 4 721 $ US |
| 2021 | 9 982 $ US | 4 605 $ US |
| 2020 | 8 798 $ US | 3 203 $ US |
| 2019 | 9 395 $ US | 3 997 $ US |
| 2018 | 9 684 $ US | 4 783 $ US |
| 2017 | 10 756 $ US | 6 001 $ US |
| 2016 | 10 984 $ US | 5 711 $ US |
| 2015 | 11 065 $ US | 4 953 $ US |
| 2014 | 12 209 $ US | 5 672 $ US |
| 2013 | 12 636 $ US | 6 223 $ US |
| 2012 | 11 777 $ US | 8 114 $ US |
| 2011 | 11 374 $ US | 8 026 $ US |
| 2010 | 10 699 $ US | 6 291 $ US |
| 2009 | 9 077 $ US | 5 416 $ US |
| 2008 | 10 913 $ US | 5 377 $ US |
| 2007 | 9 767 $ US | 4 688 $ US |
| 2006 | 7 990 $ US | 3 619 $ US |
| 2005 | 7 332 $ US | 3 132 $ US |
| 2004 | 5 980 $ US | 2 672 $ US |
| 2003 | 4 650 $ US | 2 209 $ US |
| 2002 | 3 591 $ US | 1 891 $ US |
| 2001 | 3 052 $ US | 1 881 $ US |
| 2000 | 4 199 $ US | 1 650 $ US |
| 1999 | 3 974 $ US | 1 740 $ US |
| 1998 | 4 331 $ US | 1 709 $ US |
| 1997 | 4 197 $ US | 1 790 $ US |
| 1996 | 4 041 $ US | 1 915 $ US |
| 1995 | 3 846 $ US | 1 550 $ US |
| 1994 | 2 176 $ US | 1 168 $ US |
| 1993 | 3 058 $ US | 1 038 $ US |
| 1992 | 2 744 $ US | 1 957 $ US |
| 1991 | 2 649 $ US | 2 194 $ US |
| 1990 | 2 690 $ US | 2 138 $ US |
| 1989 | 1 949 $ US | 2 125 $ US |
| 1988 | 1 686 $ US | 2 234 $ US |
| 1987 | 1 650 $ US | 2 513 $ US |
| 1986 | 1 461 $ US | 4 064 $ US |
| 1985 | 1 326 $ US | 3 634 $ US |
| 1984 | 1 209 $ US | 3 395 $ US |
| 1983 | 1 276 $ US | 3 397 $ US |
| 1982 | 1 360 $ US | 2 845 $ US |
| 1981 | 1 537 $ US | 2 393 $ US |
| 1980 | 1 516 $ US | 2 368 $ US |
| 1979 | 2 013 $ US | 2 352 $ US |
| 1978 | 1 510 $ US | 2 101 $ US |
| 1977 | 1 372 $ US | 2 243 $ US |
| 1976 | 1 228 $ US | 1 954 $ US |
| 1975 | 1 122 $ US | 1 532 $ US |
| 1974 | 881 $ US | 1 409 $ US |
| 1973 | 661 $ US | 851 $ US |
| 1972 | 537 $ US | 555 $ US |
| 1971 | 431 $ US | 457 $ US |
| 1970 | 488 $ US | 377 $ US |
| 1969 | 544 $ US | 345 $ US |
| 1968 | 501 $ US | 314 $ US |
| 1967 | 459 $ US | 283,7 $ US |
| 1966 | 425 $ US | 262,9 $ US |
| 1965 | 370 $ US | 247,5 $ US |
| 1964 | 354 $ US | 221,7 $ US |
| 1963 | 337 $ US | 209,6 $ US |
| 1962 | 298,2 $ US | 205,8 $ US |
| 1961 | 274,4 $ US | 200,1 $ US |
| 1960 | 267,1 $ US | 195,6 $ US |
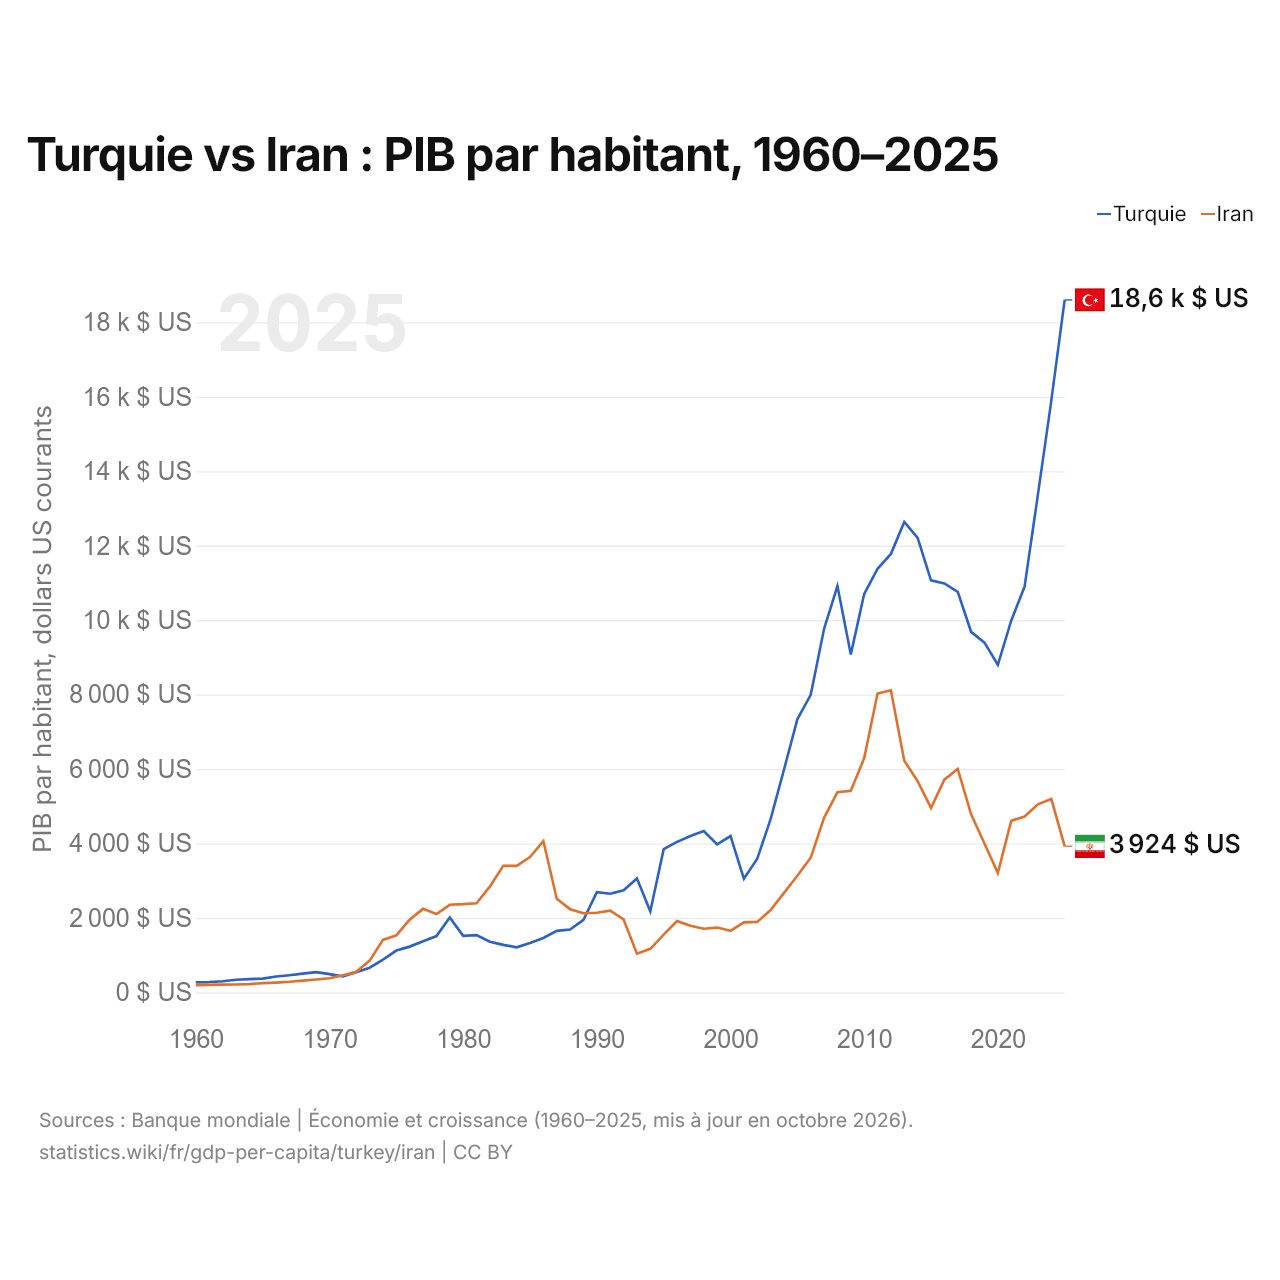
En 2025, le PIB par habitant était de 18 599 $ US en Turquie et de 3 924 $ US en Iran : 4,7 fois plus élevé en Turquie. En 1960, il était de 267 $ US en Turquie et de 196 $ US en Iran, soit 37 % de plus en Turquie.
Le PIB par habitant de la Turquie est plus élevé que celui de l'Iran chaque année depuis 1990. À prix constants de 2015, le PIB par habitant de la Turquie a été multiplié par 6,5 entre 1960 et 2025, et celui de l'Iran par 2,4.
Turquie vs Iran : derniers chiffres du PIB par habitant
|
Turquie
|
Iran
|
|
|---|---|---|
| PIB par habitant, dollars US courants | 18 599 $US | 3 924 $US |
| Rang mondial | 66/197 | 135/197 |
| PIB par habitant, dollars US constants de 2015 | 15 883 $US | 5 617 $US |
| × moyenne mondiale | 1,29× | 0,27× |
| Écart de PIB par habitant | 4,7× | 0,21× |
Comparer le PIB par habitant de 2 pays au choix
Sources :
- Banque mondiale | Économie et croissance (1960–2025, mis à jour en octobre 2026)
Creative Commons Attribution (CC BY) : vous pouvez copier, partager, adapter et réutiliser ce contenu, y compris à des fins commerciales, à condition de citer statistics.wiki et d’indiquer les modifications apportées. Les sources citées ci-dessus peuvent avoir leurs propres conditions de licence.