
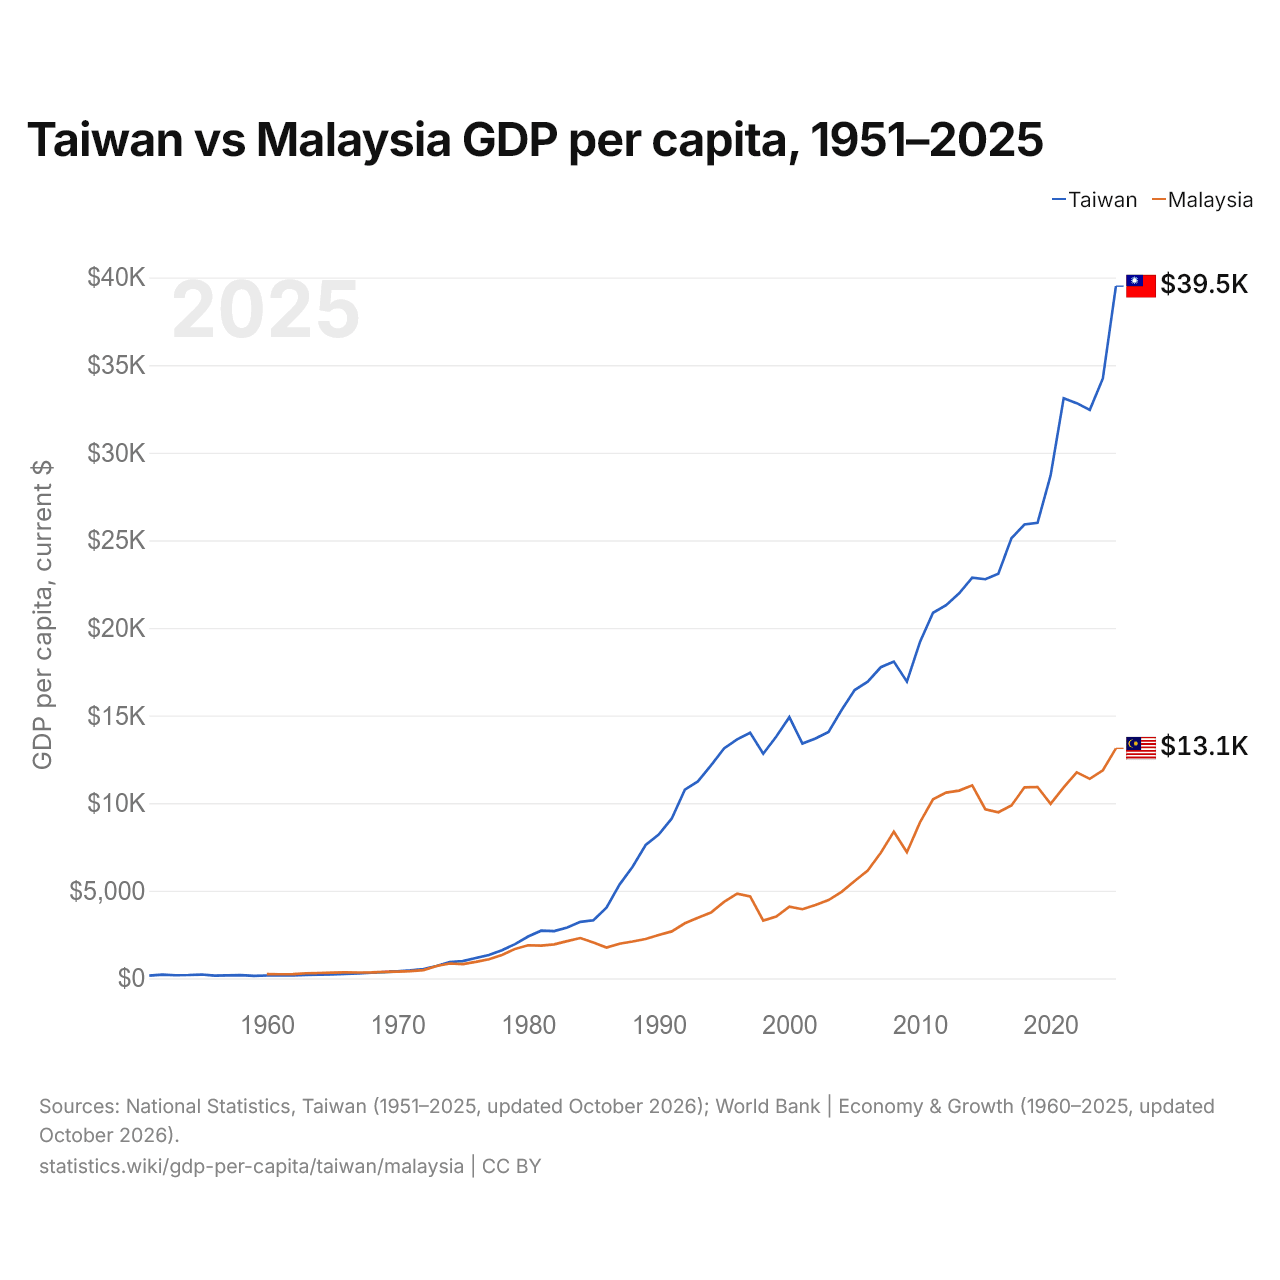
Taïwan vs Malaisie : PIB par habitant, 1951–2025
| Année | PIB par habitant, dollars US courants | |
|---|---|---|
 Taïwan |
 Malaisie |
|
| 2025 | 39 506 $ US | 13 125 $ US |
| 2024 | 34 238 $ US | 11 874 $ US |
| 2023 | 32 444 $ US | 11 386 $ US |
| 2022 | 32 827 $ US | 11 755 $ US |
| 2021 | 33 111 $ US | 10 903 $ US |
| 2020 | 28 705 $ US | 9 958 $ US |
| 2019 | 25 998 $ US | 10 920 $ US |
| 2018 | 25 901 $ US | 10 902 $ US |
| 2017 | 25 121 $ US | 9 863 $ US |
| 2016 | 23 091 $ US | 9 477 $ US |
| 2015 | 22 780 $ US | 9 649 $ US |
| 2014 | 22 874 $ US | 11 013 $ US |
| 2013 | 21 973 $ US | 10 714 $ US |
| 2012 | 21 295 $ US | 10 601 $ US |
| 2011 | 20 866 $ US | 10 217 $ US |
| 2010 | 19 197 $ US | 8 899 $ US |
| 2009 | 16 933 $ US | 7 191 $ US |
| 2008 | 18 081 $ US | 8 372 $ US |
| 2007 | 17 757 $ US | 7 169 $ US |
| 2006 | 16 934 $ US | 6 158 $ US |
| 2005 | 16 456 $ US | 5 556 $ US |
| 2004 | 15 317 $ US | 4 939 $ US |
| 2003 | 14 066 $ US | 4 465 $ US |
| 2002 | 13 686 $ US | 4 184 $ US |
| 2001 | 13 397 $ US | 3 944 $ US |
| 2000 | 14 908 $ US | 4 084 $ US |
| 1999 | 13 804 $ US | 3 528 $ US |
| 1998 | 12 820 $ US | 3 294 $ US |
| 1997 | 14 020 $ US | 4 679 $ US |
| 1996 | 13 641 $ US | 4 837 $ US |
| 1995 | 13 119 $ US | 4 363 $ US |
| 1994 | 12 150 $ US | 3 758 $ US |
| 1993 | 11 242 $ US | 3 462 $ US |
| 1992 | 10 768 $ US | 3 141 $ US |
| 1991 | 9 125 $ US | 2 679 $ US |
| 1990 | 8 205 $ US | 2 469 $ US |
| 1989 | 7 613 $ US | 2 244 $ US |
| 1988 | 6 370 $ US | 2 100 $ US |
| 1987 | 5 350 $ US | 1 977 $ US |
| 1986 | 4 036 $ US | 1 760 $ US |
| 1985 | 3 314 $ US | 2 046 $ US |
| 1984 | 3 224 $ US | 2 300 $ US |
| 1983 | 2 903 $ US | 2 124 $ US |
| 1982 | 2 699 $ US | 1 938 $ US |
| 1981 | 2 720 $ US | 1 866 $ US |
| 1980 | 2 389 $ US | 1 886 $ US |
| 1979 | 1 950 $ US | 1 680 $ US |
| 1978 | 1 606 $ US | 1 327 $ US |
| 1977 | 1 330 $ US | 1 092 $ US |
| 1976 | 1 158 $ US | 940 $ US |
| 1975 | 985 $ US | 811 $ US |
| 1974 | 934 $ US | 848 $ US |
| 1973 | 706 $ US | 701 $ US |
| 1972 | 530 $ US | 472 $ US |
| 1971 | 451 $ US | 407 $ US |
| 1970 | 397 $ US | 380 $ US |
| 1969 | 357 $ US | 368 $ US |
| 1968 | 319 $ US | 342 $ US |
| 1967 | 280,8 $ US | 335 $ US |
| 1966 | 249,1 $ US | 339 $ US |
| 1965 | 229,3 $ US | 326 $ US |
| 1964 | 213,6 $ US | 303 $ US |
| 1963 | 188,6 $ US | 291,8 $ US |
| 1962 | 172 $ US | 238,8 $ US |
| 1961 | 161,2 $ US | 232,9 $ US |
| 1960 | 163,4 $ US | 240,8 $ US |
| 1959 | 140,4 $ US | - |
| 1958 | 185,1 $ US | - |
| 1957 | 170,5 $ US | - |
| 1956 | 150,6 $ US | - |
| 1955 | 216,3 $ US | - |
| 1954 | 188,3 $ US | - |
| 1953 | 177,7 $ US | - |
| 1952 | 208,4 $ US | - |
| 1951 | 154,3 $ US | - |
En 2025, le PIB par habitant était de 39 506 $ US à Taïwan et de 13 125 $ US en Malaisie : 3,0 fois plus élevé à Taïwan. En 1960, il était de 163 $ US à Taïwan et de 241 $ US en Malaisie, soit 47 % de plus en Malaisie.
Le PIB par habitant de Taïwan est plus élevé que celui de la Malaisie chaque année depuis 1970. À prix constants de 2015, le PIB par habitant de Taïwan a été multiplié par 41 entre 1960 et 2025, et celui de la Malaisie par 9,8.
Taïwan vs Malaisie : derniers chiffres du PIB par habitant
|
Taïwan
|
Malaisie
|
|
|---|---|---|
| PIB par habitant, dollars US courants | 39 506 $US | 13 125 $US |
| Rang mondial | 30/197 | 78/197 |
| PIB par habitant, dollars US constants de 2015 | 34 565 $US | 12 352 $US |
| × moyenne mondiale | 2,74× | 0,91× |
| Écart de PIB par habitant | 3× | 0,33× |
Comparer le PIB par habitant de 2 pays au choix
Sources :
- National Statistics, Taiwan (1951–2025, mis à jour en octobre 2026)
- Banque mondiale | Économie et croissance (1960–2025, mis à jour en octobre 2026)
Creative Commons Attribution (CC BY) : vous pouvez copier, partager, adapter et réutiliser ce contenu, y compris à des fins commerciales, à condition de citer statistics.wiki et d’indiquer les modifications apportées. Les sources citées ci-dessus peuvent avoir leurs propres conditions de licence.