
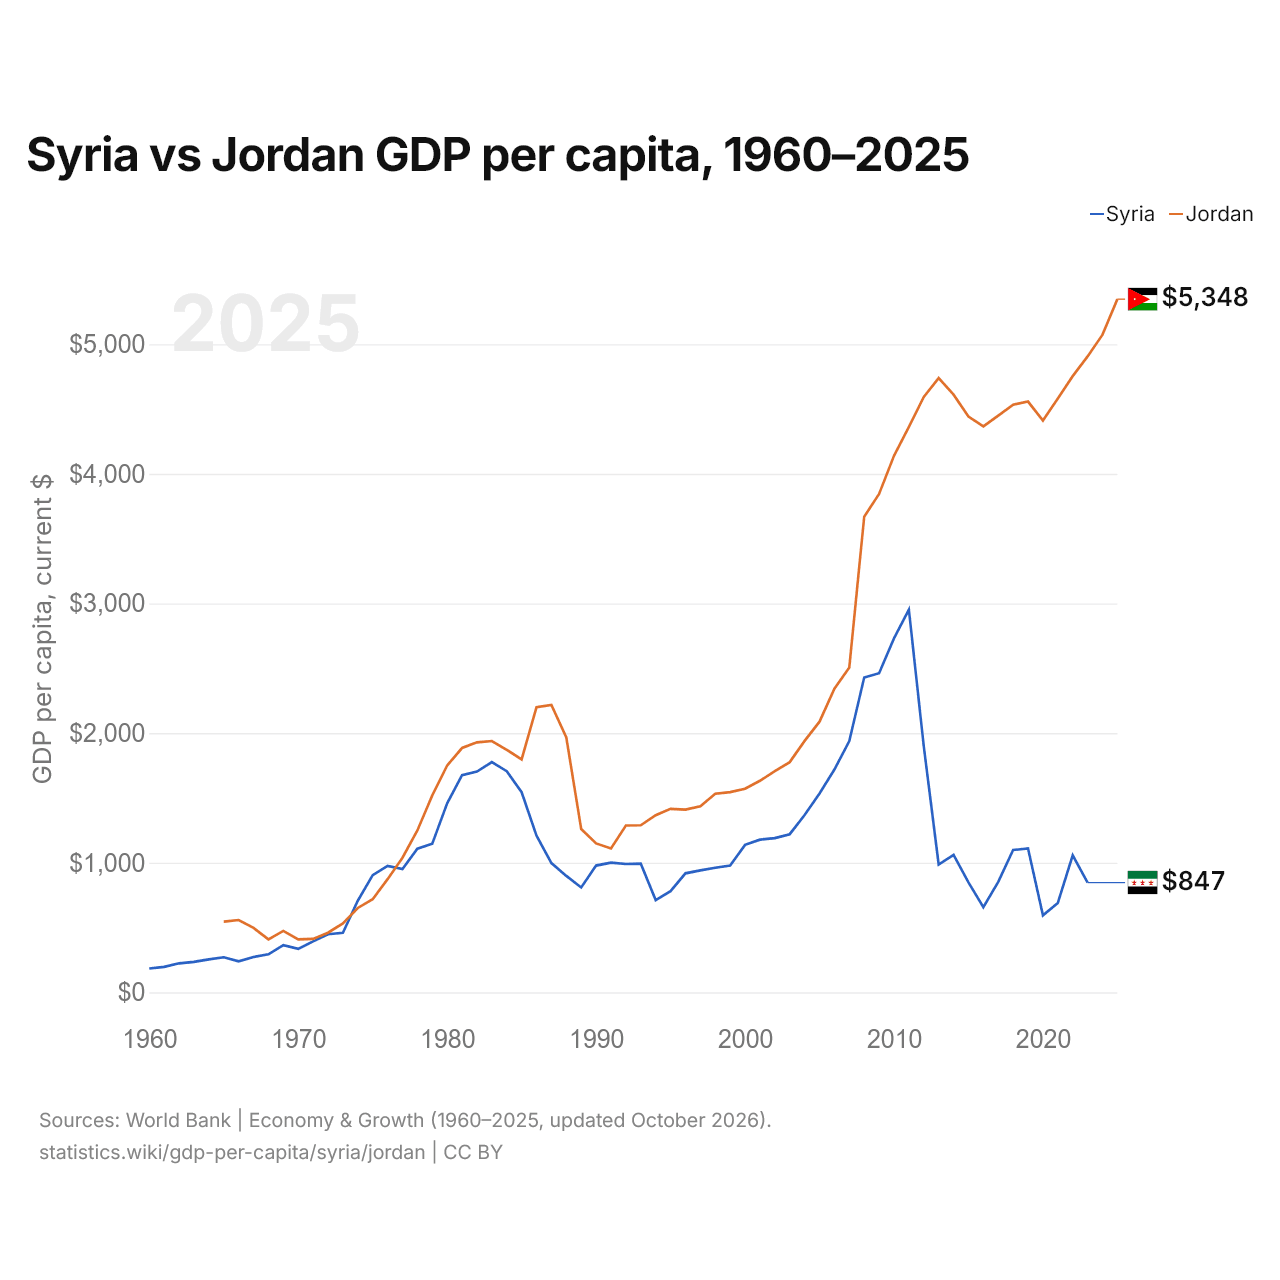
Syrie vs Jordanie : PIB par habitant, 1960–2025
| Année | PIB par habitant, dollars US courants | |
|---|---|---|
 Syrie |
 Jordanie |
|
| 2025 | - | 5 348 $ US |
| 2024 | - | 5 074 $ US |
| 2023 | 847 $ US | 4 906 $ US |
| 2022 | 1 057 $ US | 4 754 $ US |
| 2021 | 689 $ US | 4 582 $ US |
| 2020 | 594 $ US | 4 411 $ US |
| 2019 | 1 110 $ US | 4 558 $ US |
| 2018 | 1 098 $ US | 4 534 $ US |
| 2017 | 852 $ US | 4 449 $ US |
| 2016 | 656 $ US | 4 366 $ US |
| 2015 | 848 $ US | 4 442 $ US |
| 2014 | 1 061 $ US | 4 611 $ US |
| 2013 | 986 $ US | 4 739 $ US |
| 2012 | 1 898 $ US | 4 594 $ US |
| 2011 | 2 952 $ US | 4 363 $ US |
| 2010 | 2 731 $ US | 4 139 $ US |
| 2009 | 2 462 $ US | 3 845 $ US |
| 2008 | 2 429 $ US | 3 670 $ US |
| 2007 | 1 938 $ US | 2 506 $ US |
| 2006 | 1 719 $ US | 2 343 $ US |
| 2005 | 1 534 $ US | 2 088 $ US |
| 2004 | 1 368 $ US | 1 940 $ US |
| 2003 | 1 220 $ US | 1 776 $ US |
| 2002 | 1 190 $ US | 1 706 $ US |
| 2001 | 1 178 $ US | 1 632 $ US |
| 2000 | 1 138 $ US | 1 571 $ US |
| 1999 | 978 $ US | 1 545 $ US |
| 1998 | 961 $ US | 1 532 $ US |
| 1997 | 941 $ US | 1 436 $ US |
| 1996 | 918 $ US | 1 410 $ US |
| 1995 | 780 $ US | 1 416 $ US |
| 1994 | 712 $ US | 1 367 $ US |
| 1993 | 993 $ US | 1 289 $ US |
| 1992 | 990 $ US | 1 287 $ US |
| 1991 | 1 000 $ US | 1 110 $ US |
| 1990 | 978 $ US | 1 149 $ US |
| 1989 | 809 $ US | 1 260 $ US |
| 1988 | 898 $ US | 1 966 $ US |
| 1987 | 997 $ US | 2 217 $ US |
| 1986 | 1 208 $ US | 2 200 $ US |
| 1985 | 1 544 $ US | 1 797 $ US |
| 1984 | 1 706 $ US | 1 871 $ US |
| 1983 | 1 776 $ US | 1 939 $ US |
| 1982 | 1 703 $ US | 1 929 $ US |
| 1981 | 1 676 $ US | 1 885 $ US |
| 1980 | 1 458 $ US | 1 750 $ US |
| 1979 | 1 146 $ US | 1 519 $ US |
| 1978 | 1 108 $ US | 1 249 $ US |
| 1977 | 951 $ US | 1 039 $ US |
| 1976 | 976 $ US | 873 $ US |
| 1975 | 904 $ US | 718 $ US |
| 1974 | 707 $ US | 651 $ US |
| 1973 | 459 $ US | 531 $ US |
| 1972 | 448 $ US | 460 $ US |
| 1971 | 393 $ US | 412 $ US |
| 1970 | 335 $ US | 409 $ US |
| 1969 | 364 $ US | 474 $ US |
| 1968 | 293,3 $ US | 409 $ US |
| 1967 | 272,9 $ US | 497 $ US |
| 1966 | 239,3 $ US | 558 $ US |
| 1965 | 270,8 $ US | 546 $ US |
| 1964 | 254,2 $ US | - |
| 1963 | 234,9 $ US | - |
| 1962 | 223,9 $ US | - |
| 1961 | 196,3 $ US | - |
| 1960 | 183,5 $ US | - |
Le PIB par habitant était de 847 $ US en Syrie (2023) et de 4 906 $ US en Jordanie (2023) : 5,8 fois plus élevé en Jordanie. En 1965, il était de 271 $ US en Syrie et de 546 $ US en Jordanie, soit 2,0 fois plus en Jordanie.
Le PIB par habitant de la Jordanie est plus élevé que celui de la Syrie chaque année depuis 1977. À prix constants de 2015, depuis 1976, le PIB par habitant de la Syrie a reculé de 37 %, et celui de la Jordanie a progressé de 37 %.
Syrie vs Jordanie : derniers chiffres du PIB par habitant
|
Syrie
|
Jordanie
|
|
|---|---|---|
| PIB par habitant, dollars US courants | 847 $US (2023) | 5 348 $US (2025) |
| Rang mondial | 185/197 | 120/197 |
| PIB par habitant, dollars US constants de 2015 | 670 $US (2023) | 4 579 $US (2025) |
| × moyenne mondiale | 0,06× | 0,37× |
Comparer le PIB par habitant de 2 pays au choix
Sources :
- Banque mondiale | Économie et croissance (1960–2025, mis à jour en octobre 2026)
Creative Commons Attribution (CC BY) : vous pouvez copier, partager, adapter et réutiliser ce contenu, y compris à des fins commerciales, à condition de citer statistics.wiki et d’indiquer les modifications apportées. Les sources citées ci-dessus peuvent avoir leurs propres conditions de licence.