
Suisse vs Irlande : PIB par habitant, 1960–2025
| Année | PIB par habitant, dollars US courants | |
|---|---|---|
 Suisse |
 Irlande |
|
| 2025 | 114 769 $ US | 131 592 $ US |
| 2024 | 107 702 $ US | 112 895 $ US |
| 2023 | 104 450 $ US | 106 819 $ US |
| 2022 | 97 809 $ US | 105 191 $ US |
| 2021 | 96 583 $ US | 103 783 $ US |
| 2020 | 87 530 $ US | 86 514 $ US |
| 2019 | 85 873 $ US | 81 828 $ US |
| 2018 | 87 002 $ US | 80 804 $ US |
| 2017 | 83 610 $ US | 72 161 $ US |
| 2016 | 83 432 $ US | 64 130 $ US |
| 2015 | 85 265 $ US | 64 250 $ US |
| 2014 | 90 512 $ US | 57 215 $ US |
| 2013 | 88 851 $ US | 52 538 $ US |
| 2012 | 87 270 $ US | 49 336 $ US |
| 2011 | 91 910 $ US | 52 614 $ US |
| 2010 | 77 956 $ US | 48 624 $ US |
| 2009 | 72 788 $ US | 52 133 $ US |
| 2008 | 75 148 $ US | 61 353 $ US |
| 2007 | 66 082 $ US | 61 396 $ US |
| 2006 | 59 910 $ US | 54 329 $ US |
| 2005 | 57 080 $ US | 50 933 $ US |
| 2004 | 55 350 $ US | 47 754 $ US |
| 2003 | 49 947 $ US | 41 204 $ US |
| 2002 | 43 094 $ US | 32 705 $ US |
| 2001 | 40 134 $ US | 28 282 $ US |
| 2000 | 39 298 $ US | 26 335 $ US |
| 1999 | 42 261 $ US | 26 338 $ US |
| 1998 | 43 166 $ US | 24 295 $ US |
| 1997 | 42 160 $ US | 22 551 $ US |
| 1996 | 48 838 $ US | 20 836 $ US |
| 1995 | 50 869 $ US | 19 158 $ US |
| 1994 | 43 741 $ US | 15 903 $ US |
| 1993 | 39 828 $ US | 14 657 $ US |
| 1992 | 41 327 $ US | 15 714 $ US |
| 1991 | 40 140 $ US | 14 087 $ US |
| 1990 | 40 171 $ US | 14 031 $ US |
| 1989 | 31 780 $ US | 11 176 $ US |
| 1988 | 33 183 $ US | 10 716 $ US |
| 1987 | 30 899 $ US | 9 582 $ US |
| 1986 | 24 828 $ US | 8 112 $ US |
| 1985 | 17 411 $ US | 6 012 $ US |
| 1984 | 17 247 $ US | 5 692 $ US |
| 1983 | 18 128 $ US | 5 915 $ US |
| 1982 | 18 271 $ US | 6 161 $ US |
| 1981 | 17 931 $ US | 5 986 $ US |
| 1980 | 19 686 $ US | 6 372 $ US |
| 1979 | 18 541 $ US | 5 430 $ US |
| 1978 | 16 528 $ US | 4 400 $ US |
| 1977 | 11 819 $ US | 3 427 $ US |
| 1976 | 11 029 $ US | 2 920 $ US |
| 1975 | 10 484 $ US | 2 973 $ US |
| 1974 | 9 140 $ US | 2 517 $ US |
| 1973 | 7 974 $ US | 2 424 $ US |
| 1972 | 5 973 $ US | 2 080 $ US |
| 1971 | 4 908 $ US | 1 704 $ US |
| 1970 | 4 105 $ US | 1 487 $ US |
| 1969 | 3 712 $ US | 1 331 $ US |
| 1968 | 3 465 $ US | 1 159 $ US |
| 1967 | 3 286 $ US | 1 187 $ US |
| 1966 | 3 091 $ US | 1 107 $ US |
| 1965 | 2 908 $ US | 1 055 $ US |
| 1964 | 2 776 $ US | 995 $ US |
| 1963 | 2 546 $ US | 878 $ US |
| 1962 | 2 366 $ US | 821 $ US |
| 1961 | 2 188 $ US | 762 $ US |
| 1960 | 1 984 $ US | 707 $ US |
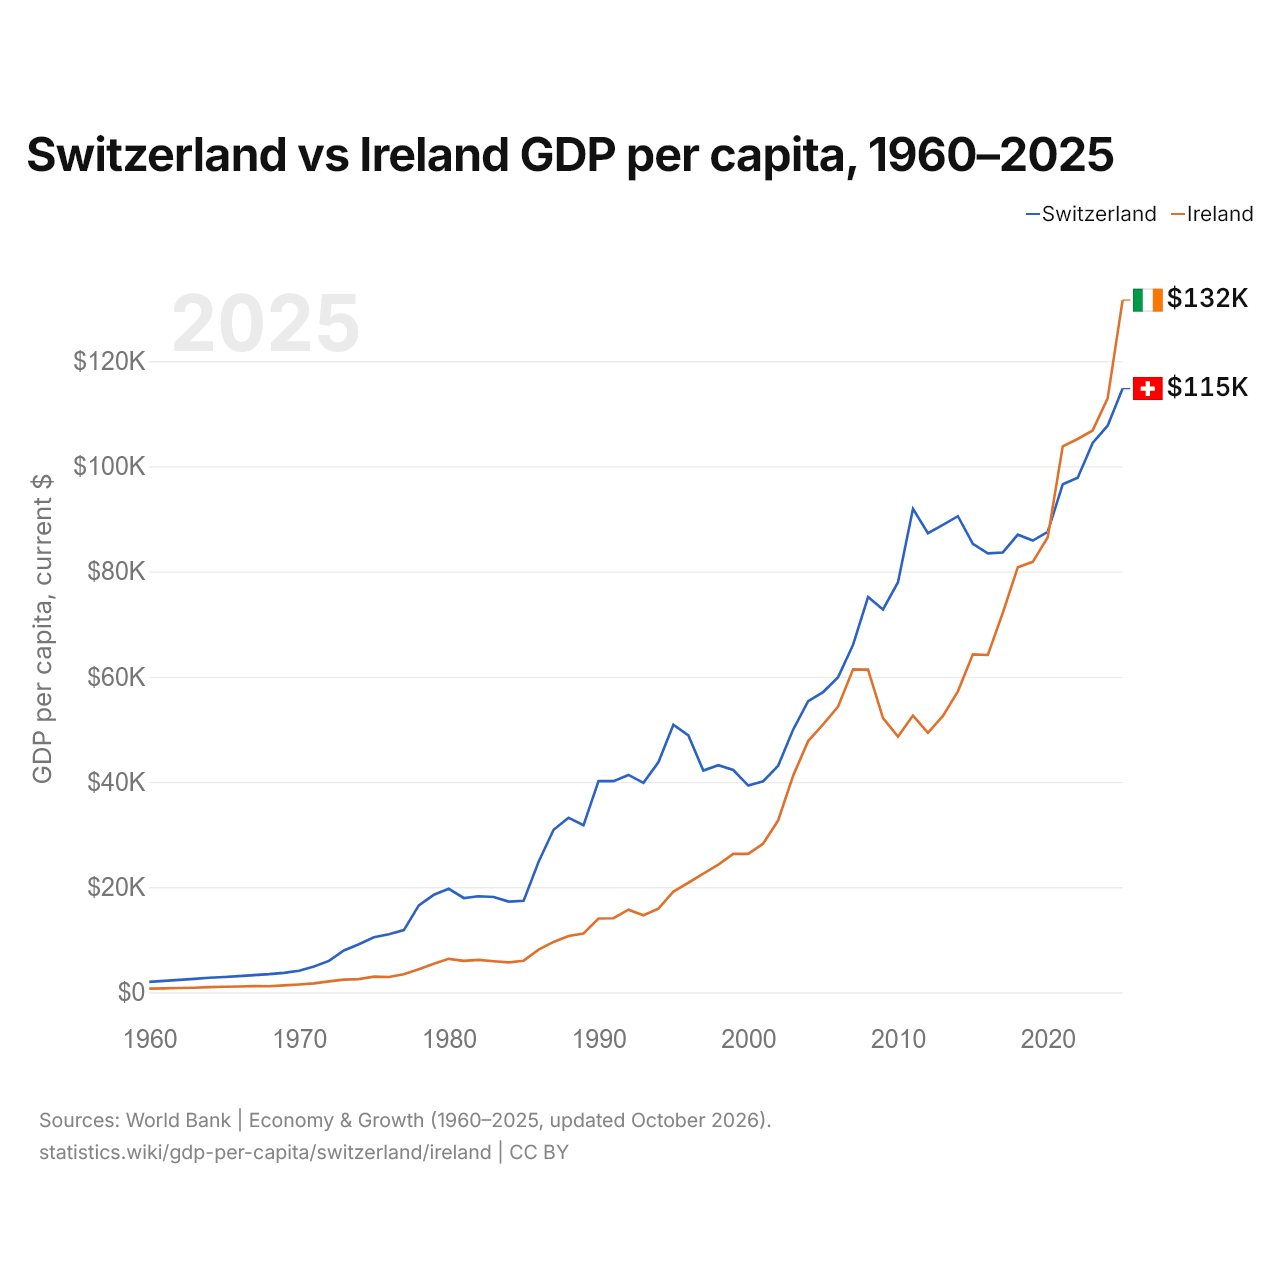
En 2025, le PIB par habitant était de 114 769 $ US en Suisse et de 131 592 $ US en Irlande : 15 % de plus en Irlande. En 1960, il était de 1 984 $ US en Suisse et de 707 $ US en Irlande, soit 2,8 fois plus en Suisse.
Le PIB par habitant de l'Irlande est plus élevé que celui de la Suisse chaque année depuis 2021. À prix constants de 2015, le PIB par habitant de la Suisse a été multiplié par 2,5 entre 1960 et 2025, et celui de l'Irlande par 12.
Suisse vs Irlande : derniers chiffres du PIB par habitant
|
Suisse
|
Irlande
|
|
|---|---|---|
| PIB par habitant, dollars US courants | 114 769 $US | 131 592 $US |
| Rang mondial | 5/197 | 4/197 |
| PIB par habitant, dollars US constants de 2015 | 93 328 $US | 104 417 $US |
| × moyenne mondiale | 7,97× | 9,13× |
| Écart de PIB par habitant | 0,87× | 1,1× |
Comparer le PIB par habitant de 2 pays au choix
Sources :
- Banque mondiale | Économie et croissance (1960–2025, mis à jour en octobre 2026)
Creative Commons Attribution (CC BY) : vous pouvez copier, partager, adapter et réutiliser ce contenu, y compris à des fins commerciales, à condition de citer statistics.wiki et d’indiquer les modifications apportées. Les sources citées ci-dessus peuvent avoir leurs propres conditions de licence.