
Suède vs Finlande : PIB par habitant, 1960–2025
| Année | PIB par habitant, dollars US courants | |
|---|---|---|
 Suède |
 Finlande |
|
| 2025 | 63 133 $ US | 56 149 $ US |
| 2024 | 57 223 $ US | 53 156 $ US |
| 2023 | 54 950 $ US | 52 865 $ US |
| 2022 | 54 837 $ US | 50 441 $ US |
| 2021 | 60 648 $ US | 53 099 $ US |
| 2020 | 52 569 $ US | 48 829 $ US |
| 2019 | 51 649 $ US | 48 358 $ US |
| 2018 | 54 018 $ US | 49 654 $ US |
| 2017 | 53 210 $ US | 46 085 $ US |
| 2016 | 51 704 $ US | 43 451 $ US |
| 2015 | 51 188 $ US | 42 560 $ US |
| 2014 | 59 583 $ US | 50 074 $ US |
| 2013 | 60 844 $ US | 49 691 $ US |
| 2012 | 57 750 $ US | 47 552 $ US |
| 2011 | 60 379 $ US | 51 060 $ US |
| 2010 | 52 543 $ US | 46 506 $ US |
| 2009 | 46 708 $ US | 47 478 $ US |
| 2008 | 55 817 $ US | 53 769 $ US |
| 2007 | 53 568 $ US | 48 473 $ US |
| 2006 | 46 531 $ US | 41 214 $ US |
| 2005 | 43 378 $ US | 39 050 $ US |
| 2004 | 42 758 $ US | 37 768 $ US |
| 2003 | 37 292 $ US | 32 920 $ US |
| 2002 | 29 958 $ US | 26 989 $ US |
| 2001 | 27 259 $ US | 24 965 $ US |
| 2000 | 29 633 $ US | 24 336 $ US |
| 1999 | 30 969 $ US | 26 180 $ US |
| 1998 | 30 605 $ US | 26 000 $ US |
| 1997 | 30 324 $ US | 24 682 $ US |
| 1996 | 33 022 $ US | 25 757 $ US |
| 1995 | 30 254 $ US | 26 246 $ US |
| 1994 | 26 046 $ US | 20 278 $ US |
| 1993 | 24 390 $ US | 17 589 $ US |
| 1992 | 32 753 $ US | 22 320 $ US |
| 1991 | 31 777 $ US | 25 489 $ US |
| 1990 | 30 549 $ US | 28 366 $ US |
| 1989 | 25 625 $ US | 23 969 $ US |
| 1988 | 24 499 $ US | 22 044 $ US |
| 1987 | 21 761 $ US | 18 565 $ US |
| 1986 | 17 955 $ US | 14 947 $ US |
| 1985 | 13 647 $ US | 11 394 $ US |
| 1984 | 13 080 $ US | 10 830 $ US |
| 1983 | 12 590 $ US | 10 494 $ US |
| 1982 | 13 719 $ US | 10 935 $ US |
| 1981 | 15 564 $ US | 10 925 $ US |
| 1980 | 17 073 $ US | 11 225 $ US |
| 1979 | 14 856 $ US | 9 333 $ US |
| 1978 | 12 602 $ US | 7 629 $ US |
| 1977 | 11 432 $ US | 7 070 $ US |
| 1976 | 10 853 $ US | 6 740 $ US |
| 1975 | 10 103 $ US | 6 256 $ US |
| 1974 | 8 078 $ US | 5 298 $ US |
| 1973 | 7 291 $ US | 4 174 $ US |
| 1972 | 6 018 $ US | 3 178 $ US |
| 1971 | 5 125 $ US | 2 716 $ US |
| 1970 | 4 729 $ US | 2 466 $ US |
| 1969 | 4 263 $ US | 2 201 $ US |
| 1968 | 3 953 $ US | 1 927 $ US |
| 1967 | 3 746 $ US | 2 056 $ US |
| 1966 | 3 478 $ US | 2 032 $ US |
| 1965 | 3 228 $ US | 1 902 $ US |
| 1964 | 2 961 $ US | 1 726 $ US |
| 1963 | 2 675 $ US | 1 538 $ US |
| 1962 | 2 485 $ US | 1 427 $ US |
| 1961 | 2 304 $ US | 1 341 $ US |
| 1960 | 2 128 $ US | 1 192 $ US |
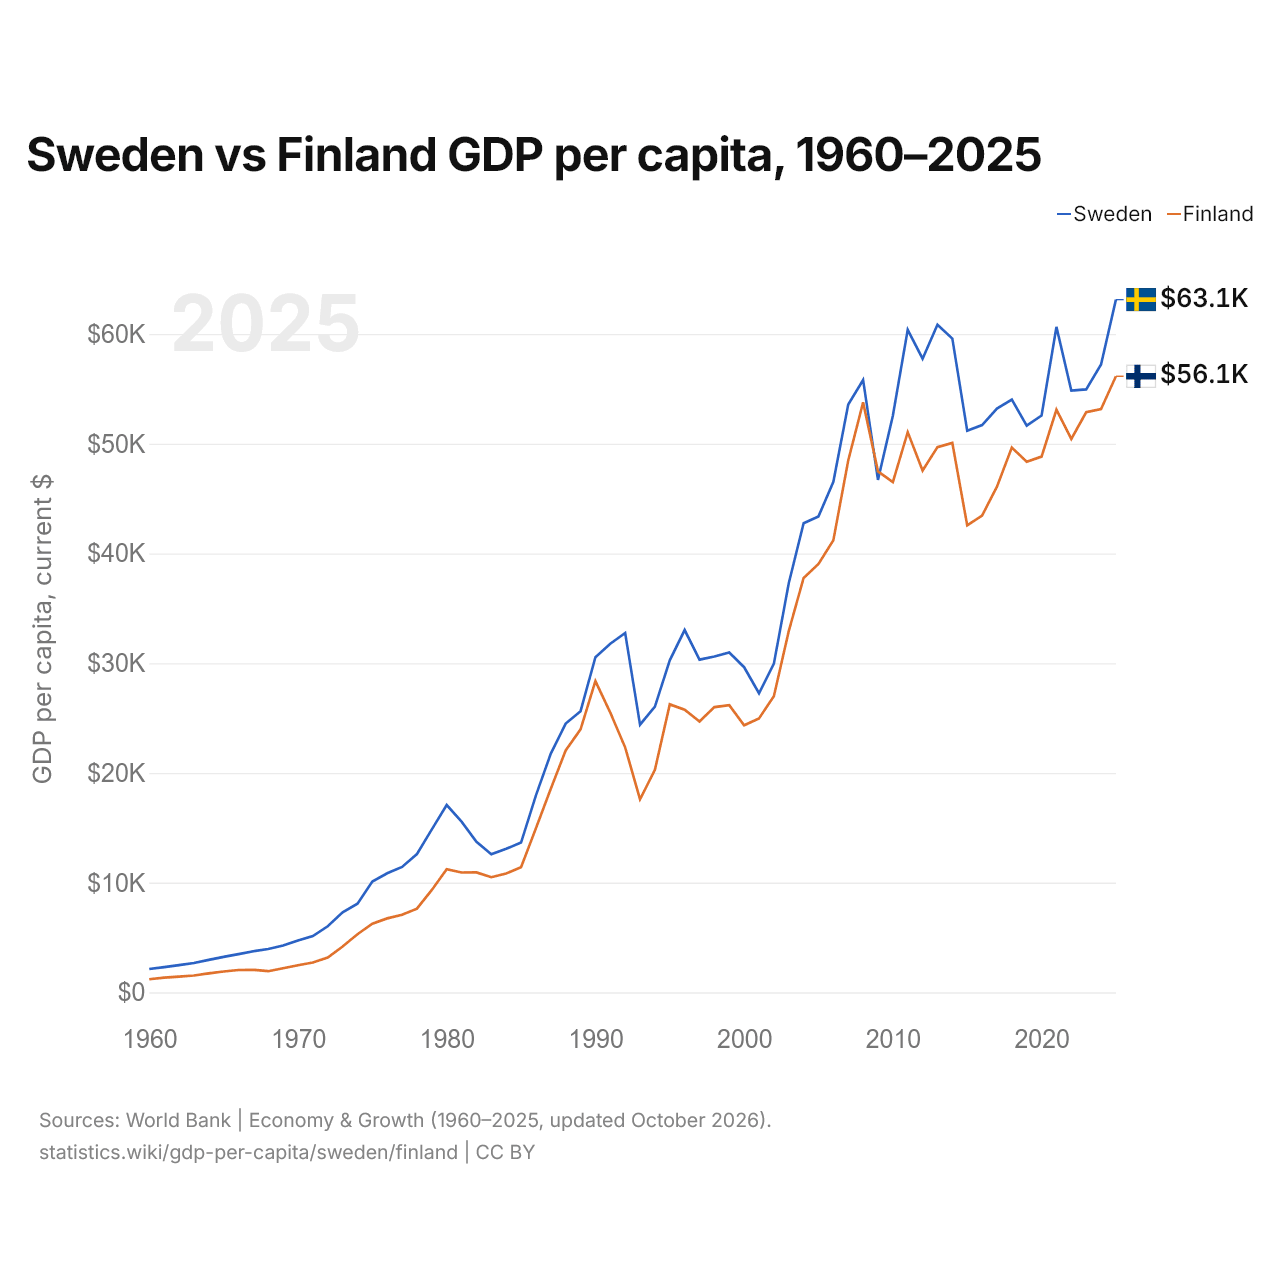
En 2025, le PIB par habitant était de 63 133 $ US en Suède et de 56 149 $ US en Finlande : 12 % de plus en Suède. En 1960, il était de 2 128 $ US en Suède et de 1 192 $ US en Finlande, soit 1,8 fois plus en Suède.
Le PIB par habitant de la Suède est plus élevé que celui de la Finlande chaque année depuis 2010. À prix constants de 2015, le PIB par habitant de la Suède a été multiplié par 3,3 entre 1960 et 2025, et celui de la Finlande par 4.
Suède vs Finlande : derniers chiffres du PIB par habitant
|
Suède
|
Finlande
|
|
|---|---|---|
| PIB par habitant, dollars US courants | 63 133 $US | 56 149 $US |
| Rang mondial | 15/197 | 22/197 |
| PIB par habitant, dollars US constants de 2015 | 55 014 $US | 44 941 $US |
| × moyenne mondiale | 4,38× | 3,9× |
| Écart de PIB par habitant | 1,1× | 0,89× |
Comparer le PIB par habitant de 2 pays au choix
Sources :
- Banque mondiale | Économie et croissance (1960–2025, mis à jour en octobre 2026)
Creative Commons Attribution (CC BY) : vous pouvez copier, partager, adapter et réutiliser ce contenu, y compris à des fins commerciales, à condition de citer statistics.wiki et d’indiquer les modifications apportées. Les sources citées ci-dessus peuvent avoir leurs propres conditions de licence.