
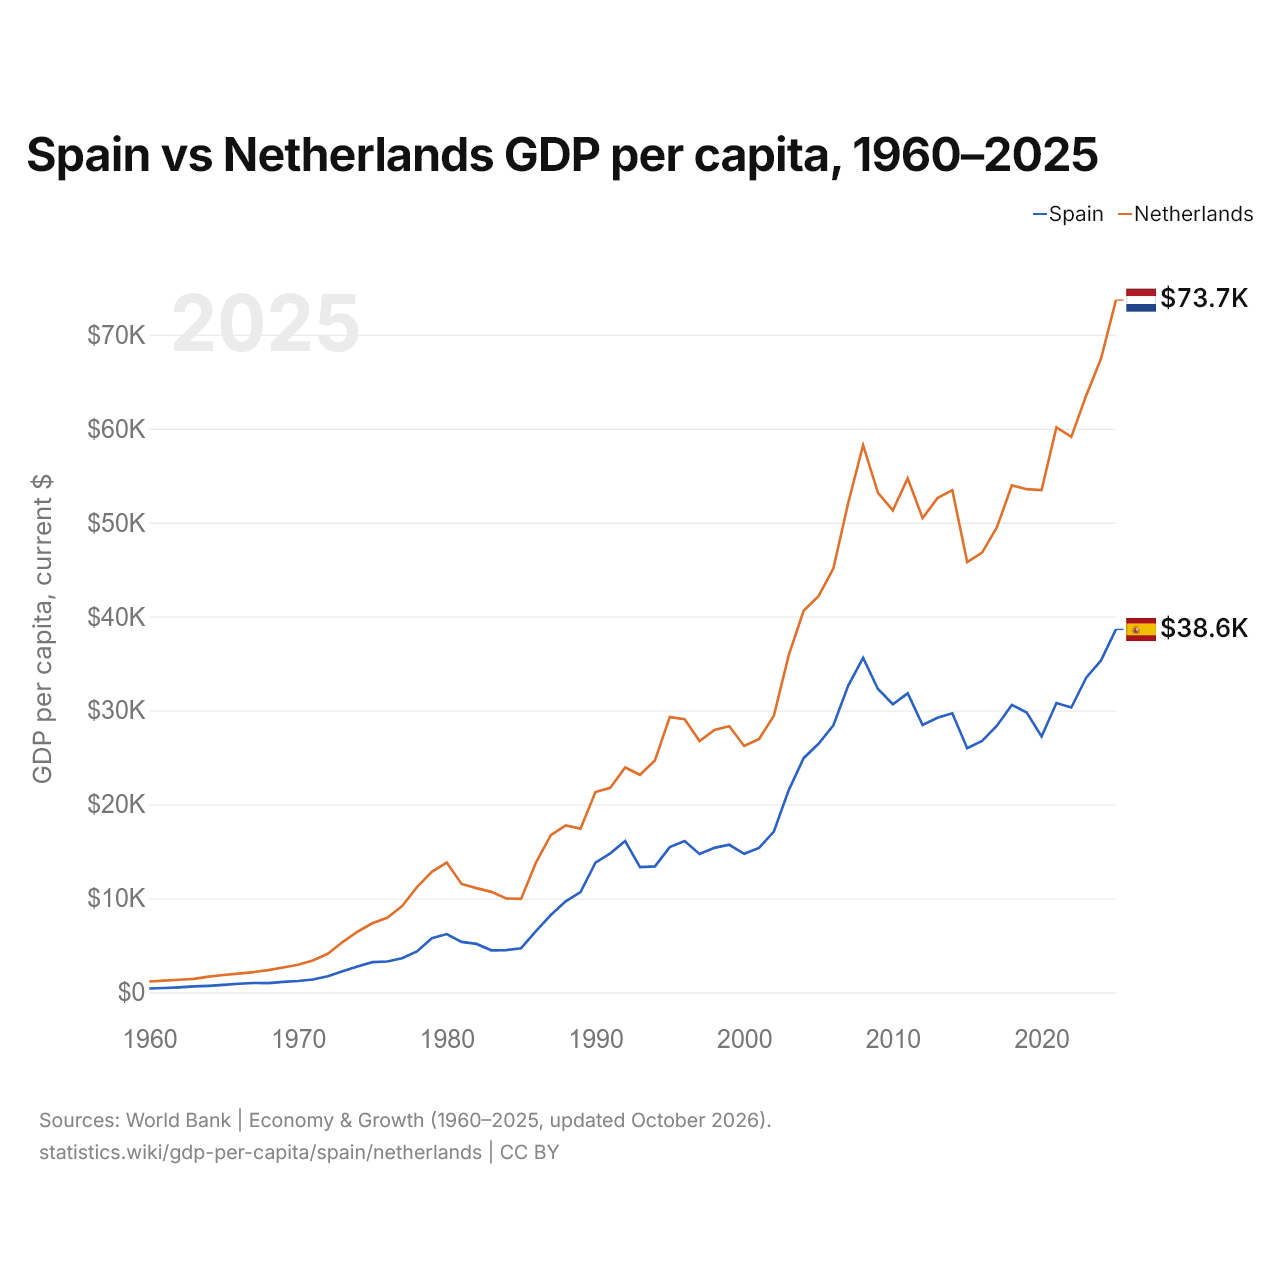
Espagne vs Pays-Bas : PIB par habitant, 1960–2025
| Année | PIB par habitant, dollars US courants | |
|---|---|---|
 Espagne |
 Pays-Bas |
|
| 2025 | 38 627 $ US | 73 684 $ US |
| 2024 | 35 327 $ US | 67 465 $ US |
| 2023 | 33 493 $ US | 63 516 $ US |
| 2022 | 30 319 $ US | 59 123 $ US |
| 2021 | 30 799 $ US | 60 142 $ US |
| 2020 | 27 234 $ US | 53 468 $ US |
| 2019 | 29 787 $ US | 53 555 $ US |
| 2018 | 30 602 $ US | 53 955 $ US |
| 2017 | 28 381 $ US | 49 514 $ US |
| 2016 | 26 756 $ US | 46 809 $ US |
| 2015 | 25 982 $ US | 45 794 $ US |
| 2014 | 29 708 $ US | 53 457 $ US |
| 2013 | 29 229 $ US | 52 602 $ US |
| 2012 | 28 456 $ US | 50 474 $ US |
| 2011 | 31 825 $ US | 54 702 $ US |
| 2010 | 30 659 $ US | 51 306 $ US |
| 2009 | 32 280 $ US | 53 172 $ US |
| 2008 | 35 603 $ US | 58 247 $ US |
| 2007 | 32 652 $ US | 52 101 $ US |
| 2006 | 28 422 $ US | 45 124 $ US |
| 2005 | 26 451 $ US | 42 165 $ US |
| 2004 | 24 925 $ US | 40 611 $ US |
| 2003 | 21 522 $ US | 35 897 $ US |
| 2002 | 17 111 $ US | 29 447 $ US |
| 2001 | 15 368 $ US | 26 956 $ US |
| 2000 | 14 743 $ US | 26 225 $ US |
| 1999 | 15 708 $ US | 28 319 $ US |
| 1998 | 15 382 $ US | 27 924 $ US |
| 1997 | 14 722 $ US | 26 745 $ US |
| 1996 | 16 101 $ US | 29 064 $ US |
| 1995 | 15 461 $ US | 29 301 $ US |
| 1994 | 13 406 $ US | 24 683 $ US |
| 1993 | 13 330 $ US | 23 156 $ US |
| 1992 | 16 101 $ US | 23 939 $ US |
| 1991 | 14 801 $ US | 21 764 $ US |
| 1990 | 13 795 $ US | 21 322 $ US |
| 1989 | 10 674 $ US | 17 423 $ US |
| 1988 | 9 696 $ US | 17 771 $ US |
| 1987 | 8 234 $ US | 16 734 $ US |
| 1986 | 6 509 $ US | 13 804 $ US |
| 1985 | 4 696 $ US | 9 941 $ US |
| 1984 | 4 487 $ US | 9 992 $ US |
| 1983 | 4 475 $ US | 10 696 $ US |
| 1982 | 5 156 $ US | 11 089 $ US |
| 1981 | 5 367 $ US | 11 537 $ US |
| 1980 | 6 204 $ US | 13 812 $ US |
| 1979 | 5 766 $ US | 12 817 $ US |
| 1978 | 4 353 $ US | 11 196 $ US |
| 1977 | 3 625 $ US | 9 180 $ US |
| 1976 | 3 277 $ US | 7 937 $ US |
| 1975 | 3 208 $ US | 7 346 $ US |
| 1974 | 2 748 $ US | 6 450 $ US |
| 1973 | 2 246 $ US | 5 353 $ US |
| 1972 | 1 708 $ US | 4 110 $ US |
| 1971 | 1 361 $ US | 3 384 $ US |
| 1970 | 1 211 $ US | 2 931 $ US |
| 1969 | 1 109 $ US | 2 647 $ US |
| 1968 | 978 $ US | 2 364 $ US |
| 1967 | 997 $ US | 2 155 $ US |
| 1966 | 916 $ US | 1 986 $ US |
| 1965 | 797 $ US | 1 848 $ US |
| 1964 | 695 $ US | 1 668 $ US |
| 1963 | 627 $ US | 1 437 $ US |
| 1962 | 535 $ US | 1 342 $ US |
| 1961 | 463 $ US | 1 254 $ US |
| 1960 | 408 $ US | 1 156 $ US |
En 2025, le PIB par habitant était de 38 627 $ US en Espagne et de 73 684 $ US aux Pays-Bas : 1,9 fois plus élevé aux Pays-Bas. En 1960, il était de 408 $ US en Espagne et de 1 156 $ US aux Pays-Bas, soit 2,8 fois plus aux Pays-Bas.
Le PIB par habitant des Pays-Bas est plus élevé que celui de l'Espagne chaque année depuis 1960. À prix constants de 2015, le PIB par habitant de l'Espagne a été multiplié par 4,7 entre 1960 et 2025, et celui des Pays-Bas par 3,6.
Espagne vs Pays-Bas : derniers chiffres du PIB par habitant
|
Espagne
|
Pays-Bas
|
|
|---|---|---|
| PIB par habitant, dollars US courants | 38 627 $US | 73 684 $US |
| Rang mondial | 32/197 | 12/197 |
| PIB par habitant, dollars US constants de 2015 | 29 763 $US | 51 817 $US |
| × moyenne mondiale | 2,68× | 5,11× |
| Écart de PIB par habitant | 0,52× | 1,9× |
Comparer le PIB par habitant de 2 pays au choix
Sources :
- Banque mondiale | Économie et croissance (1960–2025, mis à jour en octobre 2026)
Creative Commons Attribution (CC BY) : vous pouvez copier, partager, adapter et réutiliser ce contenu, y compris à des fins commerciales, à condition de citer statistics.wiki et d’indiquer les modifications apportées. Les sources citées ci-dessus peuvent avoir leurs propres conditions de licence.