
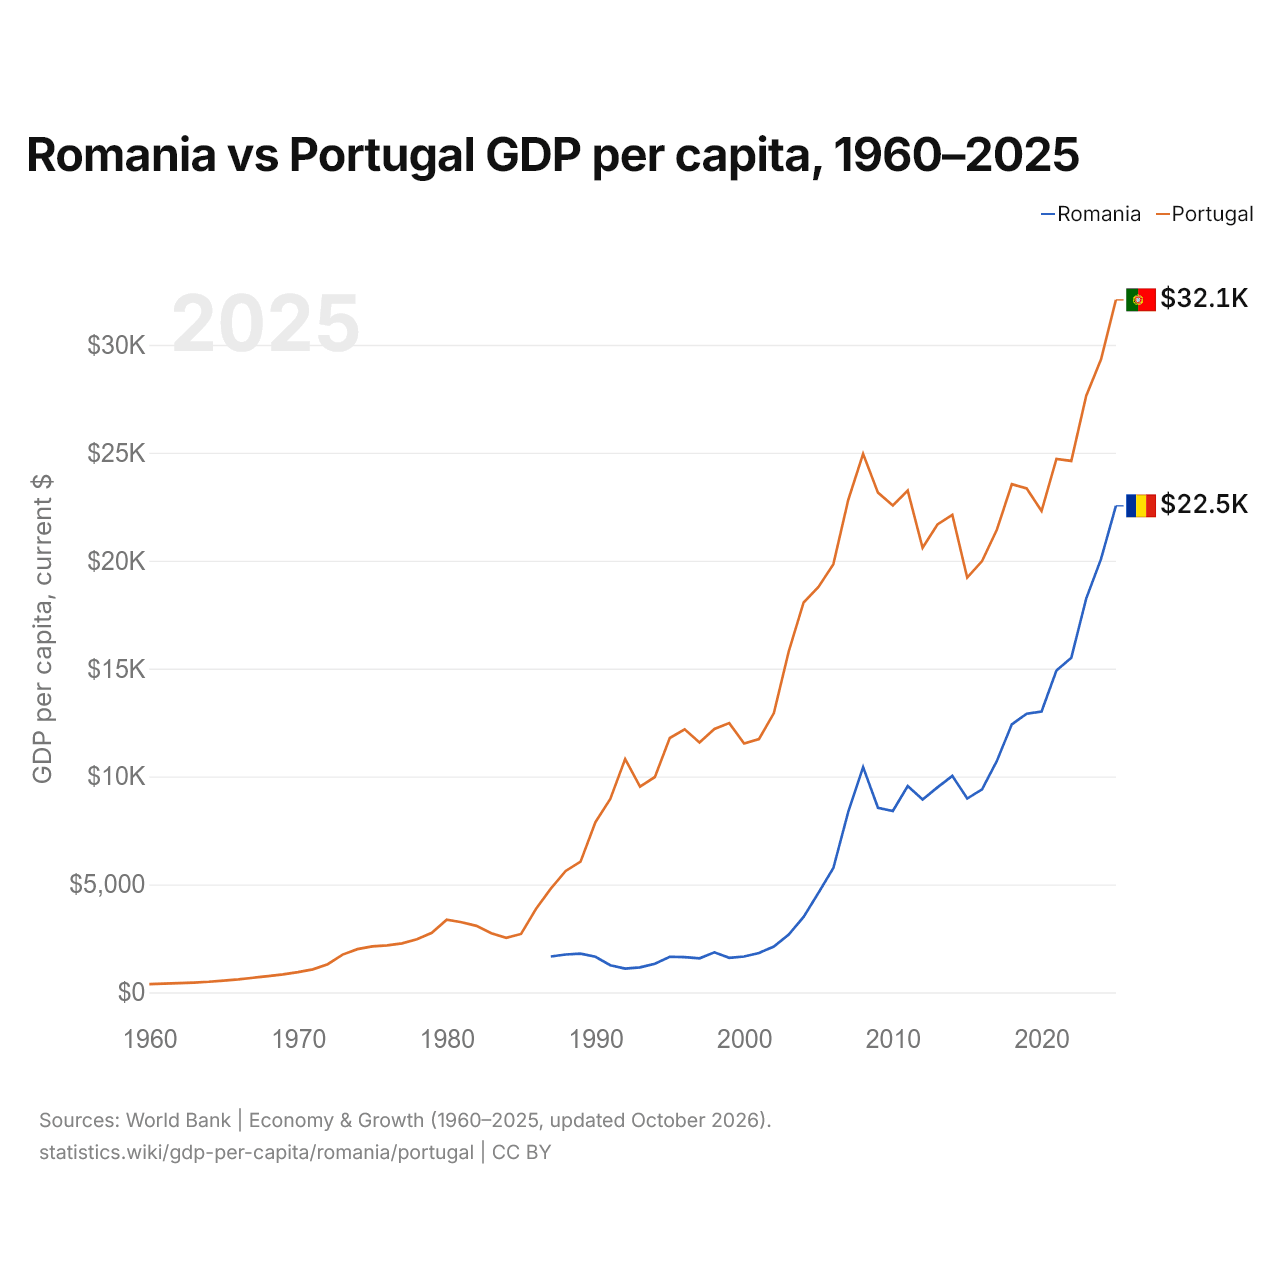
Roumanie vs Portugal : PIB par habitant, 1960–2025
| Année | PIB par habitant, dollars US courants | |
|---|---|---|
 Roumanie |
 Portugal |
|
| 2025 | 22 538 $ US | 32 082 $ US |
| 2024 | 20 080 $ US | 29 328 $ US |
| 2023 | 18 244 $ US | 27 635 $ US |
| 2022 | 15 503 $ US | 24 621 $ US |
| 2021 | 14 908 $ US | 24 711 $ US |
| 2020 | 13 009 $ US | 22 299 $ US |
| 2019 | 12 910 $ US | 23 343 $ US |
| 2018 | 12 416 $ US | 23 541 $ US |
| 2017 | 10 728 $ US | 21 442 $ US |
| 2016 | 9 405 $ US | 19 980 $ US |
| 2015 | 8 977 $ US | 19 216 $ US |
| 2014 | 10 032 $ US | 22 121 $ US |
| 2013 | 9 498 $ US | 21 676 $ US |
| 2012 | 8 930 $ US | 20 593 $ US |
| 2011 | 9 561 $ US | 23 247 $ US |
| 2010 | 8 400 $ US | 22 552 $ US |
| 2009 | 8 548 $ US | 23 151 $ US |
| 2008 | 10 435 $ US | 24 949 $ US |
| 2007 | 8 360 $ US | 22 811 $ US |
| 2006 | 5 758 $ US | 19 839 $ US |
| 2005 | 4 618 $ US | 18 780 $ US |
| 2004 | 3 495 $ US | 18 064 $ US |
| 2003 | 2 679 $ US | 15 798 $ US |
| 2002 | 2 120 $ US | 12 937 $ US |
| 2001 | 1 825 $ US | 11 735 $ US |
| 2000 | 1 660 $ US | 11 526 $ US |
| 1999 | 1 600 $ US | 12 475 $ US |
| 1998 | 1 853 $ US | 12 199 $ US |
| 1997 | 1 577 $ US | 11 576 $ US |
| 1996 | 1 633 $ US | 12 185 $ US |
| 1995 | 1 650 $ US | 11 781 $ US |
| 1994 | 1 323 $ US | 9 977 $ US |
| 1993 | 1 158 $ US | 9 535 $ US |
| 1992 | 1 102 $ US | 10 811 $ US |
| 1991 | 1 254 $ US | 8 959 $ US |
| 1990 | 1 648 $ US | 7 885 $ US |
| 1989 | 1 790 $ US | 6 056 $ US |
| 1988 | 1 753 $ US | 5 624 $ US |
| 1987 | 1 659 $ US | 4 804 $ US |
| 1986 | - | 3 862 $ US |
| 1985 | - | 2 705 $ US |
| 1984 | - | 2 523 $ US |
| 1983 | - | 2 735 $ US |
| 1982 | - | 3 080 $ US |
| 1981 | - | 3 246 $ US |
| 1980 | - | 3 368 $ US |
| 1979 | - | 2 756 $ US |
| 1978 | - | 2 457 $ US |
| 1977 | - | 2 267 $ US |
| 1976 | - | 2 173 $ US |
| 1975 | - | 2 128 $ US |
| 1974 | - | 2 000 $ US |
| 1973 | - | 1 748 $ US |
| 1972 | - | 1 302 $ US |
| 1971 | - | 1 065 $ US |
| 1970 | - | 934 $ US |
| 1969 | - | 832 $ US |
| 1968 | - | 752 $ US |
| 1967 | - | 676 $ US |
| 1966 | - | 601 $ US |
| 1965 | - | 545 $ US |
| 1964 | - | 490 $ US |
| 1963 | - | 452 $ US |
| 1962 | - | 426 $ US |
| 1961 | - | 400 $ US |
| 1960 | - | 377 $ US |
En 2025, le PIB par habitant était de 22 538 $ US en Roumanie et de 32 082 $ US au Portugal : 42 % de plus au Portugal. En 1987, il était de 1 659 $ US en Roumanie et de 4 804 $ US au Portugal, soit 2,9 fois plus au Portugal.
Le PIB par habitant du Portugal est plus élevé que celui de la Roumanie chaque année depuis 1987. À prix constants de 2015, le PIB par habitant de la Roumanie a été multiplié par 2,5 entre 1990 et 2025, et celui du Portugal par 1,6.
Roumanie vs Portugal : derniers chiffres du PIB par habitant
|
Roumanie
|
Portugal
|
|
|---|---|---|
| PIB par habitant, dollars US courants | 22 538 $US | 32 082 $US |
| Rang mondial | 57/197 | 43/197 |
| PIB par habitant, dollars US constants de 2015 | 12 565 $US | 22 851 $US |
| × moyenne mondiale | 1,56× | 2,23× |
| Écart de PIB par habitant | 0,7× | 1,4× |
Comparer le PIB par habitant de 2 pays au choix
Sources :
- Banque mondiale | Économie et croissance (1960–2025, mis à jour en octobre 2026)
Creative Commons Attribution (CC BY) : vous pouvez copier, partager, adapter et réutiliser ce contenu, y compris à des fins commerciales, à condition de citer statistics.wiki et d’indiquer les modifications apportées. Les sources citées ci-dessus peuvent avoir leurs propres conditions de licence.