
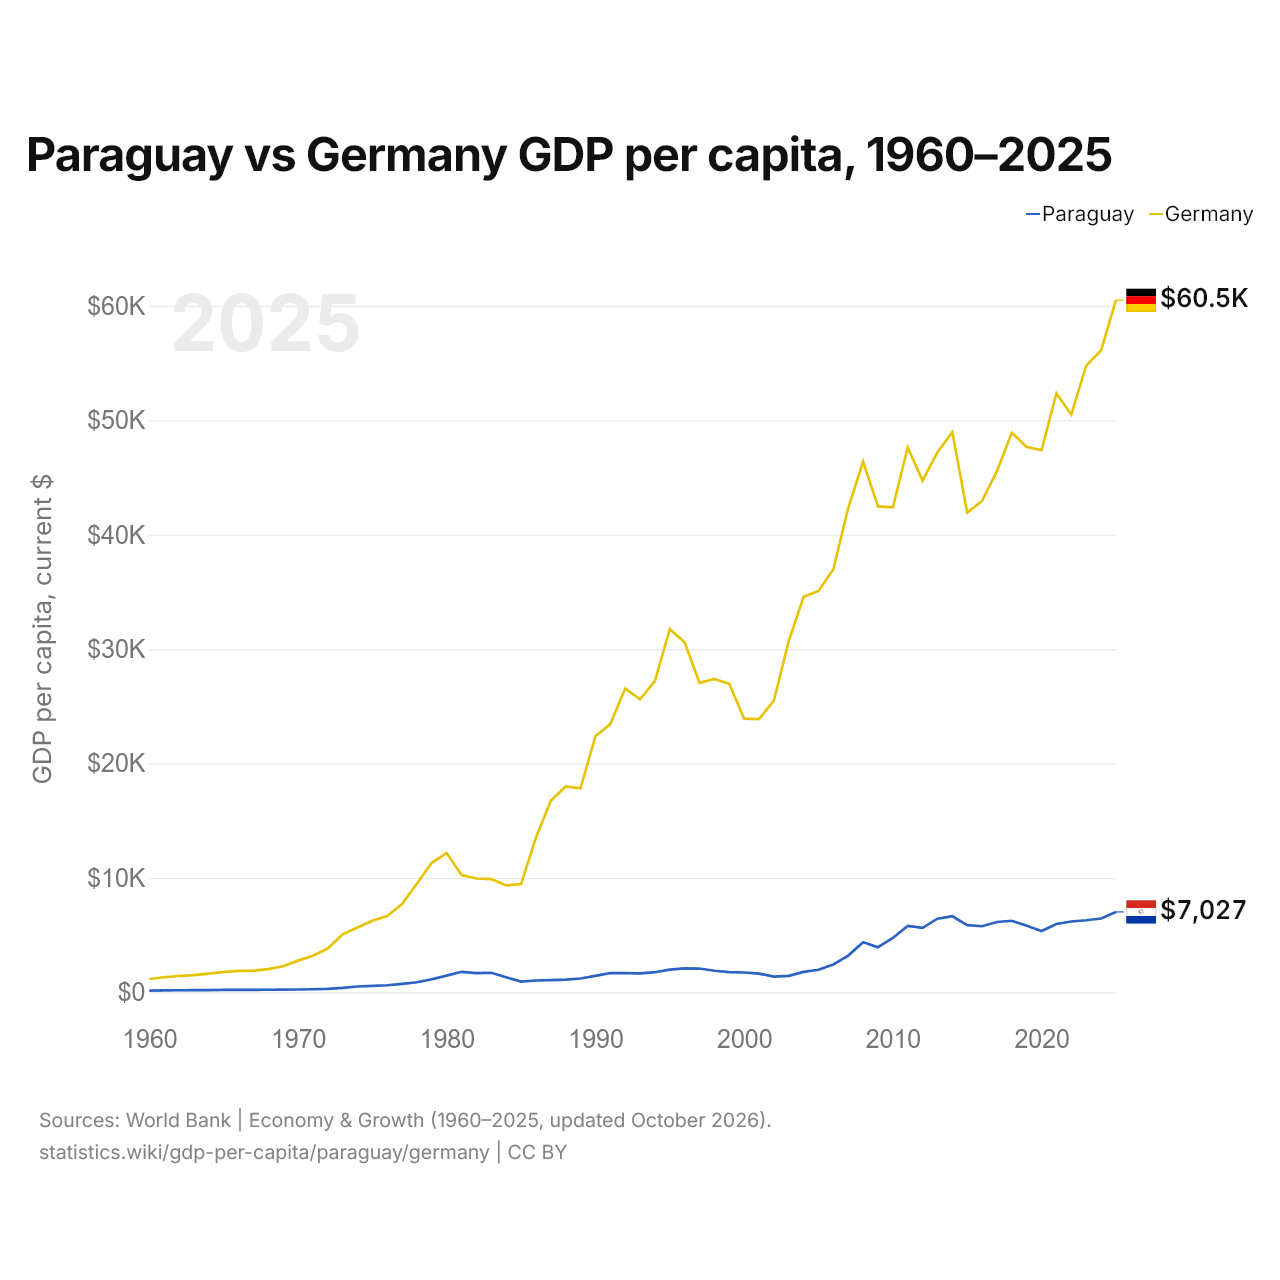
Paraguay vs Allemagne : PIB par habitant, 1960–2025
| Année | PIB par habitant, dollars US courants | |
|---|---|---|
 Paraguay |
 Allemagne |
|
| 2025 | 7 027 $ US | 60 496 $ US |
| 2024 | 6 457 $ US | 56 104 $ US |
| 2023 | 6 303 $ US | 54 777 $ US |
| 2022 | 6 189 $ US | 50 507 $ US |
| 2021 | 5 975 $ US | 52 349 $ US |
| 2020 | 5 365 $ US | 47 395 $ US |
| 2019 | 5 821 $ US | 47 656 $ US |
| 2018 | 6 258 $ US | 48 916 $ US |
| 2017 | 6 152 $ US | 45 554 $ US |
| 2016 | 5 775 $ US | 42 949 $ US |
| 2015 | 5 879 $ US | 41 930 $ US |
| 2014 | 6 652 $ US | 48 960 $ US |
| 2013 | 6 436 $ US | 47 207 $ US |
| 2012 | 5 642 $ US | 44 718 $ US |
| 2011 | 5 805 $ US | 47 631 $ US |
| 2010 | 4 751 $ US | 42 397 $ US |
| 2009 | 3 942 $ US | 42 472 $ US |
| 2008 | 4 385 $ US | 46 379 $ US |
| 2007 | 3 212 $ US | 42 351 $ US |
| 2006 | 2 439 $ US | 36 980 $ US |
| 2005 | 1 971 $ US | 35 084 $ US |
| 2004 | 1 786 $ US | 34 567 $ US |
| 2003 | 1 444 $ US | 30 711 $ US |
| 2002 | 1 368 $ US | 25 487 $ US |
| 2001 | 1 638 $ US | 23 878 $ US |
| 2000 | 1 736 $ US | 23 926 $ US |
| 1999 | 1 766 $ US | 26 965 $ US |
| 1998 | 1 890 $ US | 27 396 $ US |
| 1997 | 2 079 $ US | 27 047 $ US |
| 1996 | 2 088 $ US | 30 600 $ US |
| 1995 | 1 979 $ US | 31 747 $ US |
| 1994 | 1 760 $ US | 27 202 $ US |
| 1993 | 1 662 $ US | 25 617 $ US |
| 1992 | 1 683 $ US | 26 560 $ US |
| 1991 | 1 685 $ US | 23 443 $ US |
| 1990 | 1 440 $ US | 22 386 $ US |
| 1989 | 1 211 $ US | 17 829 $ US |
| 1988 | 1 114 $ US | 17 997 $ US |
| 1987 | 1 069 $ US | 16 739 $ US |
| 1986 | 1 031 $ US | 13 511 $ US |
| 1985 | 935 $ US | 9 464 $ US |
| 1984 | 1 319 $ US | 9 347 $ US |
| 1983 | 1 710 $ US | 9 900 $ US |
| 1982 | 1 680 $ US | 9 950 $ US |
| 1981 | 1 793 $ US | 10 246 $ US |
| 1980 | 1 457 $ US | 12 183 $ US |
| 1979 | 1 149 $ US | 11 322 $ US |
| 1978 | 883 $ US | 9 517 $ US |
| 1977 | 740 $ US | 7 711 $ US |
| 1976 | 616 $ US | 6 659 $ US |
| 1975 | 562 $ US | 6 259 $ US |
| 1974 | 508 $ US | 5 660 $ US |
| 1973 | 389 $ US | 5 065 $ US |
| 1972 | 308 $ US | 3 824 $ US |
| 1971 | 272,1 $ US | 3 204 $ US |
| 1970 | 249 $ US | 2 771 $ US |
| 1969 | 238,2 $ US | 2 281 $ US |
| 1968 | 226,8 $ US | 2 025 $ US |
| 1967 | 220,9 $ US | 1 886 $ US |
| 1966 | 213,9 $ US | 1 871 $ US |
| 1965 | 208,7 $ US | 1 774 $ US |
| 1964 | 197 $ US | 1 637 $ US |
| 1963 | 189,9 $ US | 1 502 $ US |
| 1962 | 182,8 $ US | 1 431 $ US |
| 1961 | 167,1 $ US | 1 316 $ US |
| 1960 | 153,4 $ US | 1 162 $ US |
En 2025, le PIB par habitant était de 7 027 $ US au Paraguay et de 60 496 $ US en Allemagne : 8,6 fois plus élevé en Allemagne. En 1960, il était de 153 $ US au Paraguay et de 1 162 $ US en Allemagne, soit 7,6 fois plus en Allemagne.
Le PIB par habitant de l'Allemagne est plus élevé que celui du Paraguay chaque année depuis 1960. À prix constants de 2015, le PIB par habitant du Paraguay a été multiplié par 4,7 entre 1960 et 2025, et celui de l'Allemagne par 3,5.
Paraguay vs Allemagne : derniers chiffres du PIB par habitant
|
Paraguay
|
Allemagne
|
|
|---|---|---|
| PIB par habitant, dollars US courants | 7 027 $US | 60 496 $US |
| Rang mondial | 105/197 | 18/197 |
| PIB par habitant, dollars US constants de 2015 | 7 029 $US | 44 147 $US |
| × moyenne mondiale | 0,49× | 4,2× |
| Écart de PIB par habitant | 0,12× | 8,6× |
Comparer le PIB par habitant de 2 pays au choix
Sources :
- Banque mondiale | Économie et croissance (1960–2025, mis à jour en octobre 2026)
Creative Commons Attribution (CC BY) : vous pouvez copier, partager, adapter et réutiliser ce contenu, y compris à des fins commerciales, à condition de citer statistics.wiki et d’indiquer les modifications apportées. Les sources citées ci-dessus peuvent avoir leurs propres conditions de licence.