
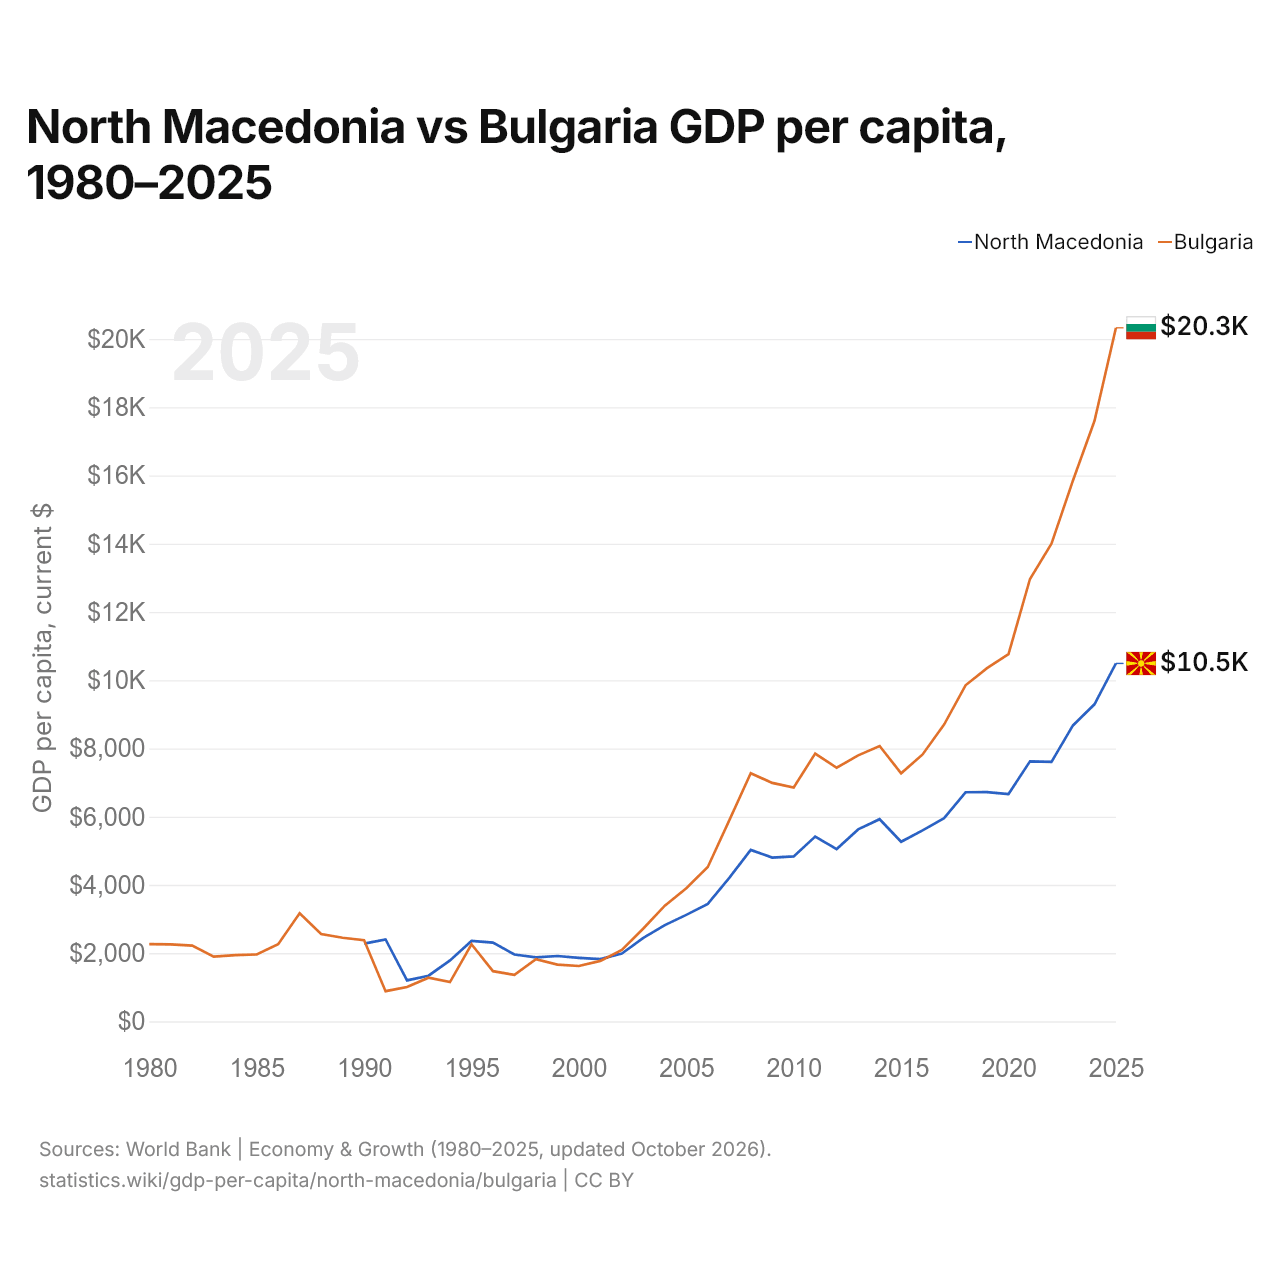
Macédoine du Nord vs Bulgarie : PIB par habitant, 1980–2025
| Année | PIB par habitant, dollars US courants | |
|---|---|---|
 Macédoine du Nord |
 Bulgarie |
|
| 2025 | 10 490 $ US | 20 328 $ US |
| 2024 | 9 292 $ US | 17 597 $ US |
| 2023 | 8 674 $ US | 15 854 $ US |
| 2022 | 7 606 $ US | 14 000 $ US |
| 2021 | 7 621 $ US | 12 967 $ US |
| 2020 | 6 660 $ US | 10 761 $ US |
| 2019 | 6 719 $ US | 10 354 $ US |
| 2018 | 6 714 $ US | 9 850 $ US |
| 2017 | 5 955 $ US | 8 697 $ US |
| 2016 | 5 598 $ US | 7 823 $ US |
| 2015 | 5 263 $ US | 7 269 $ US |
| 2014 | 5 925 $ US | 8 070 $ US |
| 2013 | 5 626 $ US | 7 796 $ US |
| 2012 | 5 050 $ US | 7 432 $ US |
| 2011 | 5 417 $ US | 7 850 $ US |
| 2010 | 4 833 $ US | 6 854 $ US |
| 2009 | 4 800 $ US | 6 989 $ US |
| 2008 | 5 026 $ US | 7 272 $ US |
| 2007 | 4 204 $ US | 5 889 $ US |
| 2006 | 3 440 $ US | 4 523 $ US |
| 2005 | 3 121 $ US | 3 900 $ US |
| 2004 | 2 819 $ US | 3 390 $ US |
| 2003 | 2 445 $ US | 2 720 $ US |
| 2002 | 1 989 $ US | 2 093 $ US |
| 2001 | 1 823 $ US | 1 771 $ US |
| 2000 | 1 862 $ US | 1 621 $ US |
| 1999 | 1 915 $ US | 1 661 $ US |
| 1998 | 1 876 $ US | 1 821 $ US |
| 1997 | 1 960 $ US | 1 361 $ US |
| 1996 | 2 307 $ US | 1 470 $ US |
| 1995 | 2 355 $ US | 2 259 $ US |
| 1994 | 1 786 $ US | 1 150 $ US |
| 1993 | 1 337 $ US | 1 279 $ US |
| 1992 | 1 199 $ US | 1 007 $ US |
| 1991 | 2 402 $ US | 884 $ US |
| 1990 | 2 277 $ US | 2 377 $ US |
| 1989 | - | 2 450 $ US |
| 1988 | - | 2 561 $ US |
| 1987 | - | 3 169 $ US |
| 1986 | - | 2 262 $ US |
| 1985 | - | 1 960 $ US |
| 1984 | - | 1 943 $ US |
| 1983 | - | 1 897 $ US |
| 1982 | - | 2 221 $ US |
| 1981 | - | 2 256 $ US |
| 1980 | - | 2 261 $ US |
En 2025, le PIB par habitant était de 10 490 $ US en Macédoine du Nord et de 20 328 $ US en Bulgarie : 1,9 fois plus élevé en Bulgarie. En 1990, il était de 2 277 $ US en Macédoine du Nord et de 2 377 $ US en Bulgarie, soit 4,4 % de plus en Bulgarie.
Le PIB par habitant de la Bulgarie est plus élevé que celui de la Macédoine du Nord chaque année depuis 2002. À prix constants de 2015, le PIB par habitant de la Macédoine du Nord a été multiplié par 1,9 entre 1990 et 2025, et celui de la Bulgarie par 2,4.
Macédoine du Nord vs Bulgarie : derniers chiffres du PIB par habitant
|
Macédoine du Nord
|
Bulgarie
|
|
|---|---|---|
| PIB par habitant, dollars US courants | 10 490 $US | 20 328 $US |
| Rang mondial | 86/197 | 58/197 |
| PIB par habitant, dollars US constants de 2015 | 6 873 $US | 10 454 $US |
| × moyenne mondiale | 0,73× | 1,41× |
| Écart de PIB par habitant | 0,52× | 1,9× |
Comparer le PIB par habitant de 2 pays au choix
Sources :
- Banque mondiale | Économie et croissance (1980–2025, mis à jour en octobre 2026)
Creative Commons Attribution (CC BY) : vous pouvez copier, partager, adapter et réutiliser ce contenu, y compris à des fins commerciales, à condition de citer statistics.wiki et d’indiquer les modifications apportées. Les sources citées ci-dessus peuvent avoir leurs propres conditions de licence.