
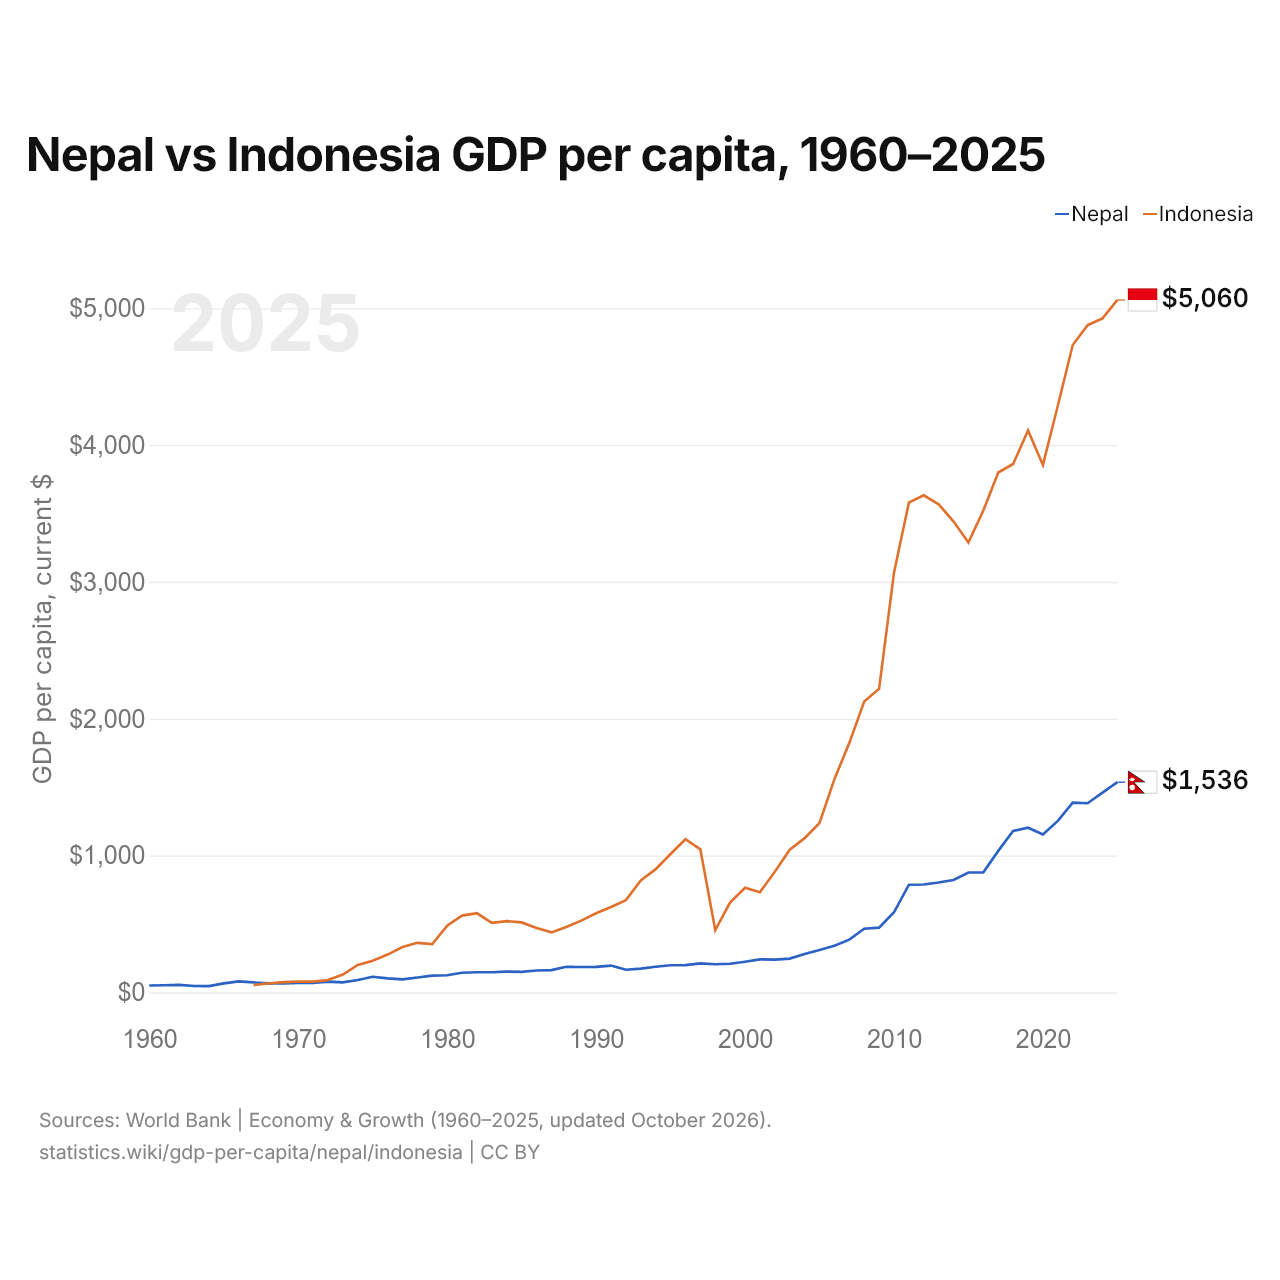
Népal vs Indonésie : PIB par habitant, 1960–2025
| Année | PIB par habitant, dollars US courants | |
|---|---|---|
 Népal |
 Indonésie |
|
| 2025 | 1 536 $ US | 5 060 $ US |
| 2024 | 1 460 $ US | 4 925 $ US |
| 2023 | 1 382 $ US | 4 876 $ US |
| 2022 | 1 386 $ US | 4 731 $ US |
| 2021 | 1 253 $ US | 4 287 $ US |
| 2020 | 1 154 $ US | 3 854 $ US |
| 2019 | 1 203 $ US | 4 107 $ US |
| 2018 | 1 179 $ US | 3 861 $ US |
| 2017 | 1 034 $ US | 3 799 $ US |
| 2016 | 877 $ US | 3 521 $ US |
| 2015 | 876 $ US | 3 288 $ US |
| 2014 | 821 $ US | 3 441 $ US |
| 2013 | 803 $ US | 3 567 $ US |
| 2012 | 788 $ US | 3 632 $ US |
| 2011 | 786 $ US | 3 579 $ US |
| 2010 | 585 $ US | 3 066 $ US |
| 2009 | 473 $ US | 2 218 $ US |
| 2008 | 465 $ US | 2 125 $ US |
| 2007 | 385 $ US | 1 823 $ US |
| 2006 | 340 $ US | 1 558 $ US |
| 2005 | 309 $ US | 1 238 $ US |
| 2004 | 279,6 $ US | 1 127 $ US |
| 2003 | 246,4 $ US | 1 043 $ US |
| 2002 | 238,9 $ US | 881 $ US |
| 2001 | 240,8 $ US | 732 $ US |
| 2000 | 223,8 $ US | 764 $ US |
| 1999 | 208,6 $ US | 657 $ US |
| 1998 | 205,1 $ US | 455 $ US |
| 1997 | 211,8 $ US | 1 045 $ US |
| 1996 | 198,8 $ US | 1 119 $ US |
| 1995 | 197,8 $ US | 1 011 $ US |
| 1994 | 187,3 $ US | 900 $ US |
| 1993 | 172,8 $ US | 817 $ US |
| 1992 | 165 $ US | 674 $ US |
| 1991 | 195,7 $ US | 624 $ US |
| 1990 | 185,8 $ US | 578 $ US |
| 1989 | 185 $ US | 524 $ US |
| 1988 | 187,1 $ US | 477 $ US |
| 1987 | 162 $ US | 438 $ US |
| 1986 | 159,5 $ US | 470 $ US |
| 1985 | 149,9 $ US | 511 $ US |
| 1984 | 151,1 $ US | 520 $ US |
| 1983 | 146,6 $ US | 508 $ US |
| 1982 | 147 $ US | 578 $ US |
| 1981 | 142,9 $ US | 561 $ US |
| 1980 | 125,1 $ US | 487 $ US |
| 1979 | 121,9 $ US | 353 $ US |
| 1978 | 108,1 $ US | 362 $ US |
| 1977 | 95,3 $ US | 331 $ US |
| 1976 | 102,5 $ US | 275,7 $ US |
| 1975 | 113,6 $ US | 231,1 $ US |
| 1974 | 89,8 $ US | 200,7 $ US |
| 1973 | 73,2 $ US | 129,9 $ US |
| 1972 | 78,8 $ US | 90,1 $ US |
| 1971 | 69,5 $ US | 78,5 $ US |
| 1970 | 69,6 $ US | 79,1 $ US |
| 1969 | 64,8 $ US | 74,1 $ US |
| 1968 | 64,9 $ US | 64,7 $ US |
| 1967 | 72,3 $ US | 53,2 $ US |
| 1966 | 79,5 $ US | - |
| 1965 | 65,8 $ US | - |
| 1964 | 45,3 $ US | - |
| 1963 | 46,3 $ US | - |
| 1962 | 54,6 $ US | - |
| 1961 | 51,6 $ US | - |
| 1960 | 50,2 $ US | - |
En 2025, le PIB par habitant était de 1 536 $ US au Népal et de 5 060 $ US en Indonésie : 3,3 fois plus élevé en Indonésie. En 1967, il était de 72 $ US au Népal et de 53 $ US en Indonésie, soit 36 % de plus au Népal.
Le PIB par habitant de l'Indonésie est plus élevé que celui du Népal chaque année depuis 1969. À prix constants de 2015, le PIB par habitant du Népal a été multiplié par 3,8 entre 1960 et 2025, et celui de l'Indonésie par 7,6.
Népal vs Indonésie : derniers chiffres du PIB par habitant
Comparer le PIB par habitant de 2 pays au choix
Sources :
- Banque mondiale | Économie et croissance (1960–2025, mis à jour en octobre 2026)
Creative Commons Attribution (CC BY) : vous pouvez copier, partager, adapter et réutiliser ce contenu, y compris à des fins commerciales, à condition de citer statistics.wiki et d’indiquer les modifications apportées. Les sources citées ci-dessus peuvent avoir leurs propres conditions de licence.