
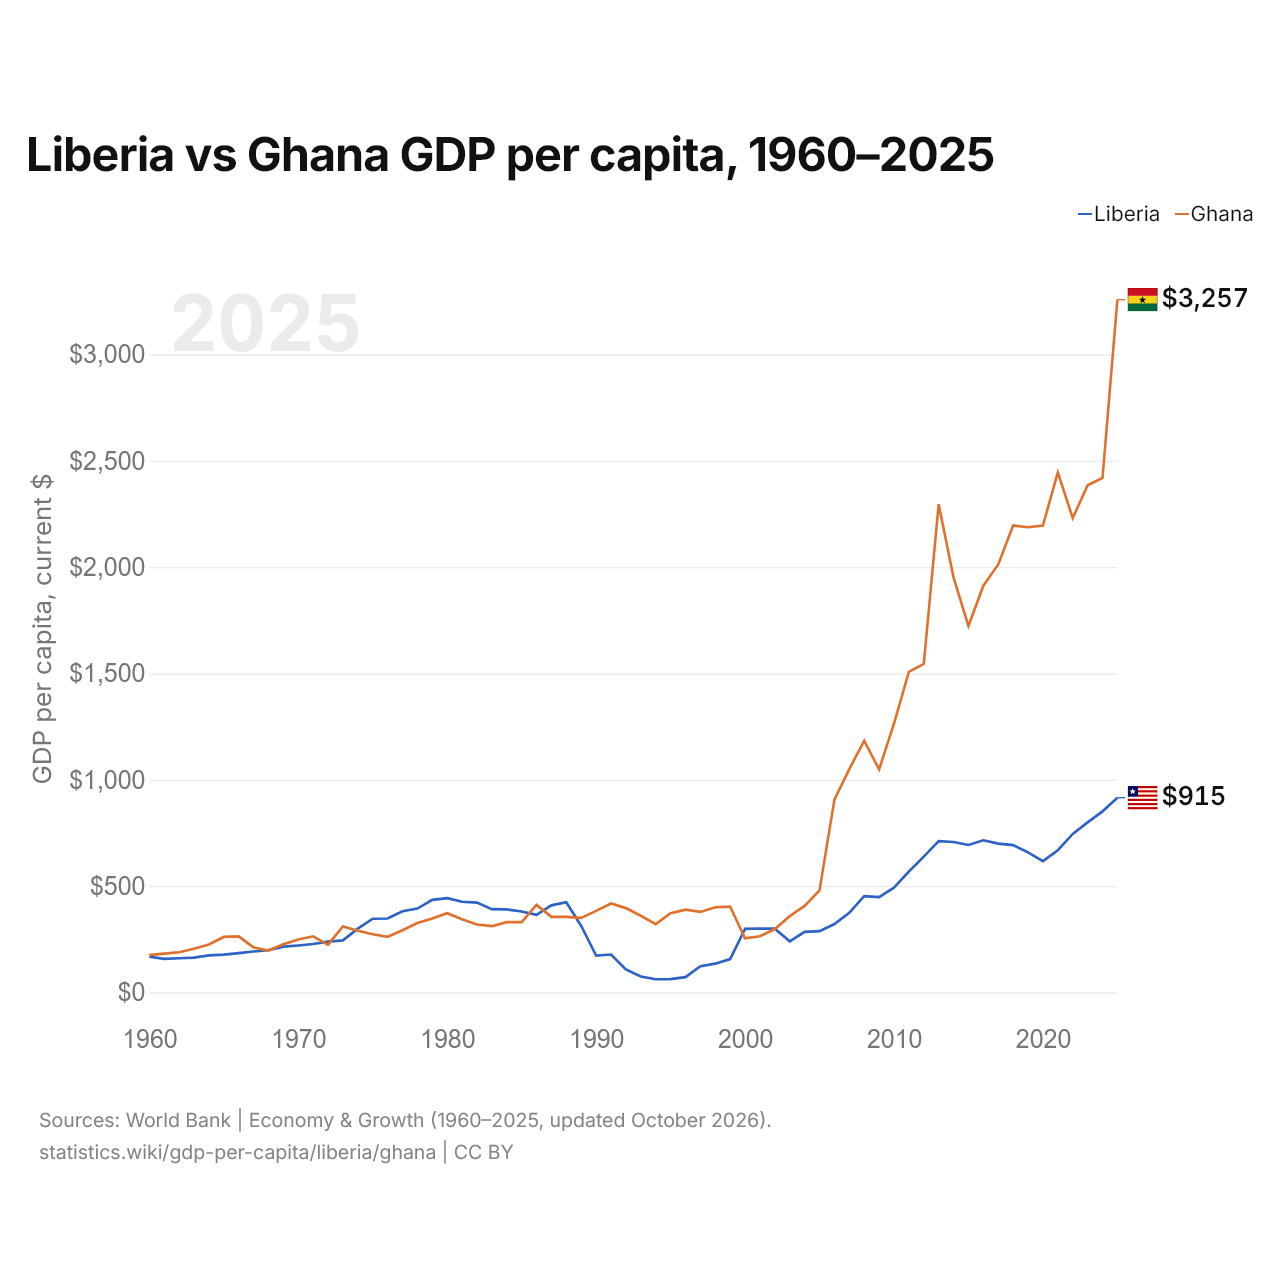
Liberia vs Ghana : PIB par habitant, 1960–2025
| Année | PIB par habitant, dollars US courants | |
|---|---|---|
 Liberia |
 Ghana |
|
| 2025 | 915 $ US | 3 257 $ US |
| 2024 | 851 $ US | 2 419 $ US |
| 2023 | 799 $ US | 2 384 $ US |
| 2022 | 745 $ US | 2 230 $ US |
| 2021 | 668 $ US | 2 445 $ US |
| 2020 | 617 $ US | 2 195 $ US |
| 2019 | 658 $ US | 2 187 $ US |
| 2018 | 692 $ US | 2 195 $ US |
| 2017 | 699 $ US | 2 012 $ US |
| 2016 | 715 $ US | 1 912 $ US |
| 2015 | 693 $ US | 1 723 $ US |
| 2014 | 707 $ US | 1 950 $ US |
| 2013 | 711 $ US | 2 295 $ US |
| 2012 | 638 $ US | 1 544 $ US |
| 2011 | 568 $ US | 1 507 $ US |
| 2010 | 492 $ US | 1 264 $ US |
| 2009 | 448 $ US | 1 048 $ US |
| 2008 | 452 $ US | 1 183 $ US |
| 2007 | 374 $ US | 1 050 $ US |
| 2006 | 321 $ US | 906 $ US |
| 2005 | 287,5 $ US | 479 $ US |
| 2004 | 284,1 $ US | 406 $ US |
| 2003 | 239,8 $ US | 358 $ US |
| 2002 | 299,5 $ US | 297,5 $ US |
| 2001 | 300 $ US | 263,5 $ US |
| 2000 | 298,5 $ US | 253,7 $ US |
| 1999 | 156,6 $ US | 403 $ US |
| 1998 | 134,7 $ US | 400 $ US |
| 1997 | 122,6 $ US | 378 $ US |
| 1996 | 71,4 $ US | 389 $ US |
| 1995 | 62,1 $ US | 372 $ US |
| 1994 | 61,5 $ US | 321 $ US |
| 1993 | 74,4 $ US | 360 $ US |
| 1992 | 107,8 $ US | 396 $ US |
| 1991 | 177,9 $ US | 418 $ US |
| 1990 | 172,9 $ US | 383 $ US |
| 1989 | 312 $ US | 350 $ US |
| 1988 | 424 $ US | 355 $ US |
| 1987 | 409 $ US | 355 $ US |
| 1986 | 364 $ US | 411 $ US |
| 1985 | 380 $ US | 330 $ US |
| 1984 | 390 $ US | 330 $ US |
| 1983 | 391 $ US | 311 $ US |
| 1982 | 422 $ US | 319 $ US |
| 1981 | 426 $ US | 344 $ US |
| 1980 | 443 $ US | 372 $ US |
| 1979 | 435 $ US | 347 $ US |
| 1978 | 394 $ US | 326 $ US |
| 1977 | 381 $ US | 292,3 $ US |
| 1976 | 347 $ US | 261 $ US |
| 1975 | 346 $ US | 273 $ US |
| 1974 | 299,4 $ US | 289,4 $ US |
| 1973 | 244,4 $ US | 310 $ US |
| 1972 | 238,6 $ US | 223,8 $ US |
| 1971 | 227,1 $ US | 263,4 $ US |
| 1970 | 220,3 $ US | 248,2 $ US |
| 1969 | 214,7 $ US | 225,8 $ US |
| 1968 | 198,6 $ US | 196,7 $ US |
| 1967 | 192,2 $ US | 211,2 $ US |
| 1966 | 184,6 $ US | 263,3 $ US |
| 1965 | 177,6 $ US | 260,5 $ US |
| 1964 | 173,9 $ US | 225 $ US |
| 1963 | 163,1 $ US | 205 $ US |
| 1962 | 160,3 $ US | 188,4 $ US |
| 1961 | 157,5 $ US | 181,9 $ US |
| 1960 | 167,2 $ US | 174,9 $ US |
En 2025, le PIB par habitant était de 915 $ US au Liberia et de 3 257 $ US au Ghana : 3,6 fois plus élevé au Ghana. En 1960, il était de 167 $ US au Liberia et de 175 $ US au Ghana, soit 4,6 % de plus au Ghana.
Le PIB par habitant du Ghana est plus élevé que celui du Liberia chaque année depuis 2003. À prix constants de 2015, entre 1960 et 2025, le PIB par habitant du Liberia a reculé de 72 %, et celui du Ghana a progressé de 105 %.
Liberia vs Ghana : derniers chiffres du PIB par habitant
Comparer le PIB par habitant de 2 pays au choix
Sources :
- Banque mondiale | Économie et croissance (1960–2025, mis à jour en octobre 2026)
Creative Commons Attribution (CC BY) : vous pouvez copier, partager, adapter et réutiliser ce contenu, y compris à des fins commerciales, à condition de citer statistics.wiki et d’indiquer les modifications apportées. Les sources citées ci-dessus peuvent avoir leurs propres conditions de licence.