
Kazakhstan vs Belgique : PIB par habitant, 1960–2025
| Année | PIB par habitant, dollars US courants | |
|---|---|---|
 Kazakhstan |
 Belgique |
|
| 2025 | 14 692 $ US | 60 750 $ US |
| 2024 | 14 155 $ US | 56 582 $ US |
| 2023 | 12 879 $ US | 55 245 $ US |
| 2022 | 11 255 $ US | 50 639 $ US |
| 2021 | 9 984 $ US | 51 658 $ US |
| 2020 | 8 782 $ US | 45 906 $ US |
| 2019 | 9 457 $ US | 46 717 $ US |
| 2018 | 9 472 $ US | 47 487 $ US |
| 2017 | 8 943 $ US | 44 035 $ US |
| 2016 | 7 476 $ US | 41 855 $ US |
| 2015 | 10 196 $ US | 40 894 $ US |
| 2014 | 12 428 $ US | 47 996 $ US |
| 2013 | 13 478 $ US | 46 965 $ US |
| 2012 | 12 019 $ US | 44 874 $ US |
| 2011 | 11 287 $ US | 47 761 $ US |
| 2010 | 8 793 $ US | 44 197 $ US |
| 2009 | 6 938 $ US | 44 923 $ US |
| 2008 | 8 124 $ US | 48 303 $ US |
| 2007 | 6 449 $ US | 44 319 $ US |
| 2006 | 5 030 $ US | 38 705 $ US |
| 2005 | 3 577 $ US | 36 810 $ US |
| 2004 | 2 722 $ US | 35 429 $ US |
| 2003 | 1 958 $ US | 30 655 $ US |
| 2002 | 1 574 $ US | 25 006 $ US |
| 2001 | 1 422 $ US | 23 015 $ US |
| 2000 | 1 180 $ US | 23 099 $ US |
| 1999 | 1 092 $ US | 25 253 $ US |
| 1998 | 1 415 $ US | 25 338 $ US |
| 1997 | 1 382 $ US | 24 821 $ US |
| 1996 | 1 281 $ US | 27 490 $ US |
| 1995 | 1 218 $ US | 28 414 $ US |
| 1994 | 1 247 $ US | 24 209 $ US |
| 1993 | 1 355 $ US | 22 284 $ US |
| 1992 | 1 438 $ US | 23 373 $ US |
| 1991 | 1 442 $ US | 21 042 $ US |
| 1990 | 1 570 $ US | 20 600 $ US |
| 1989 | - | 16 525 $ US |
| 1988 | - | 16 391 $ US |
| 1987 | - | 15 136 $ US |
| 1986 | - | 12 170 $ US |
| 1985 | - | 8 751 $ US |
| 1984 | - | 8 457 $ US |
| 1983 | - | 8 846 $ US |
| 1982 | - | 9 344 $ US |
| 1981 | - | 10 623 $ US |
| 1980 | - | 12 864 $ US |
| 1979 | - | 11 811 $ US |
| 1978 | - | 10 290 $ US |
| 1977 | - | 8 427 $ US |
| 1976 | - | 7 243 $ US |
| 1975 | - | 6 701 $ US |
| 1974 | - | 5 734 $ US |
| 1973 | - | 4 901 $ US |
| 1972 | - | 3 832 $ US |
| 1971 | - | 3 083 $ US |
| 1970 | - | 2 766 $ US |
| 1969 | - | 2 490 $ US |
| 1968 | - | 2 251 $ US |
| 1967 | - | 2 114 $ US |
| 1966 | - | 1 983 $ US |
| 1965 | - | 1 860 $ US |
| 1964 | - | 1 724 $ US |
| 1963 | - | 1 555 $ US |
| 1962 | - | 1 457 $ US |
| 1961 | - | 1 368 $ US |
| 1960 | - | 1 290 $ US |
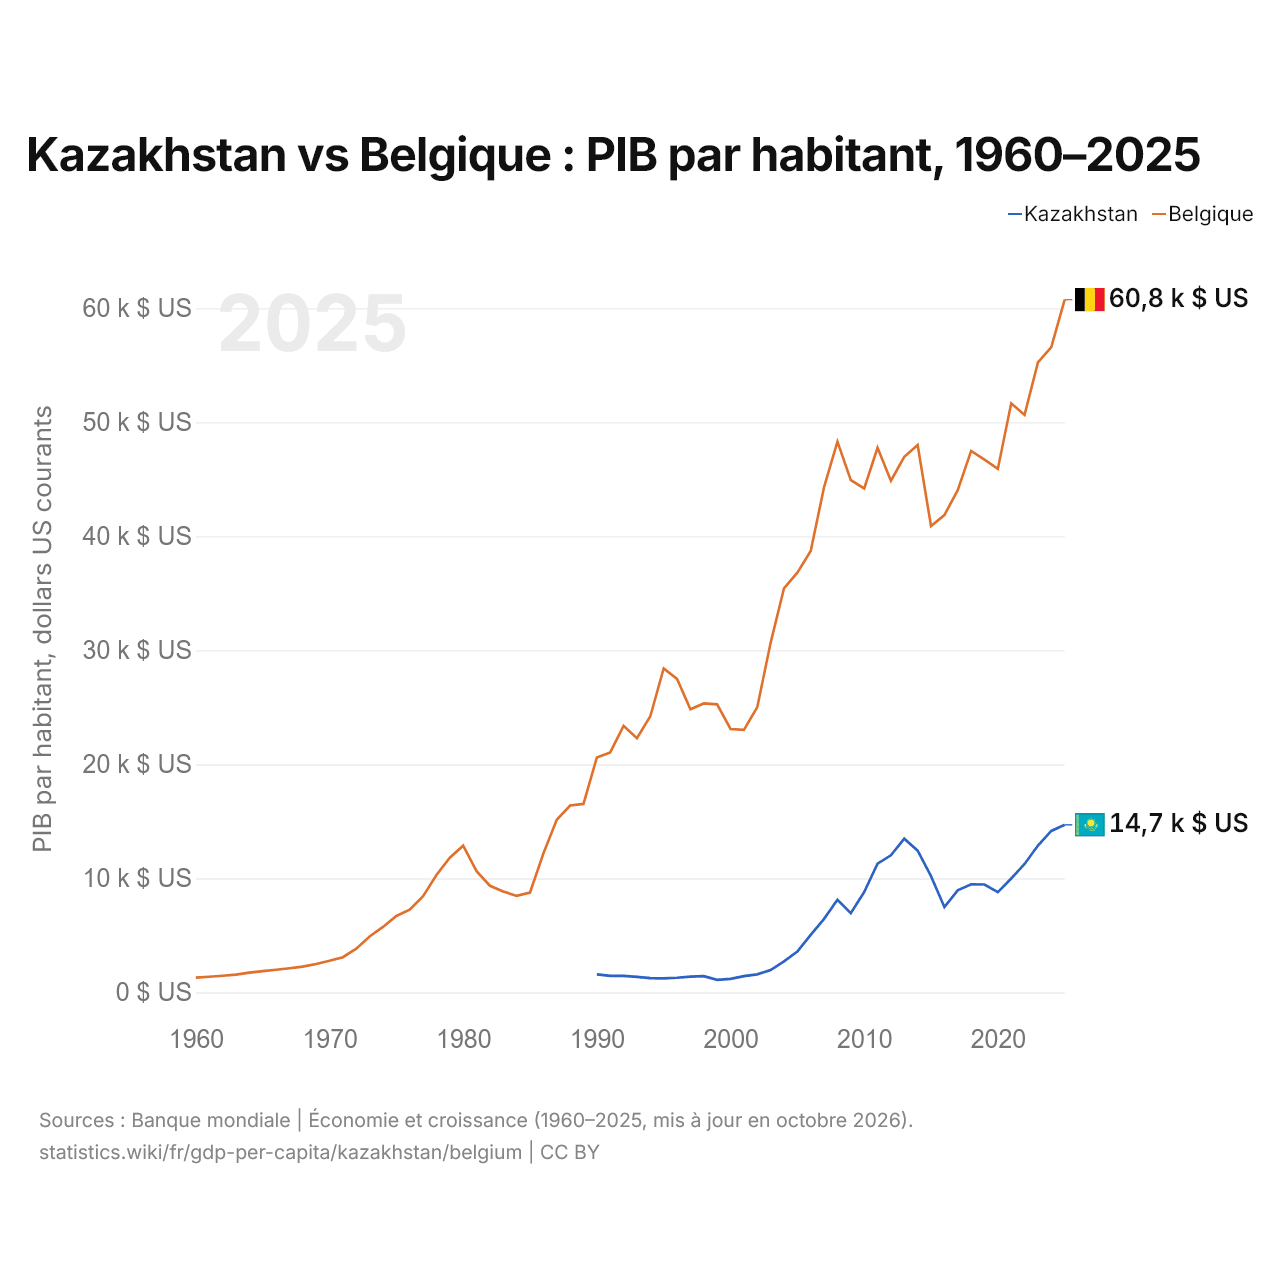
En 2025, le PIB par habitant était de 14 692 $ US au Kazakhstan et de 60 750 $ US en Belgique : 4,1 fois plus élevé en Belgique. En 1990, il était de 1 570 $ US au Kazakhstan et de 20 600 $ US en Belgique, soit 13 fois plus en Belgique.
Le PIB par habitant de la Belgique est plus élevé que celui du Kazakhstan chaque année depuis 1990. À prix constants de 2015, le PIB par habitant du Kazakhstan a été multiplié par 2,2 entre 1990 et 2025, et celui de la Belgique par 1,5.
Kazakhstan vs Belgique : derniers chiffres du PIB par habitant
|
Kazakhstan
|
Belgique
|
|
|---|---|---|
| PIB par habitant, dollars US courants | 14 692 $US | 60 750 $US |
| Rang mondial | 73/197 | 17/197 |
| PIB par habitant, dollars US constants de 2015 | 12 492 $US | 45 146 $US |
| × moyenne mondiale | 1,02× | 4,22× |
| Écart de PIB par habitant | 0,24× | 4,1× |
Comparer le PIB par habitant de 2 pays au choix
Sources :
- Banque mondiale | Économie et croissance (1960–2025, mis à jour en octobre 2026)
Creative Commons Attribution (CC BY) : vous pouvez copier, partager, adapter et réutiliser ce contenu, y compris à des fins commerciales, à condition de citer statistics.wiki et d’indiquer les modifications apportées. Les sources citées ci-dessus peuvent avoir leurs propres conditions de licence.