
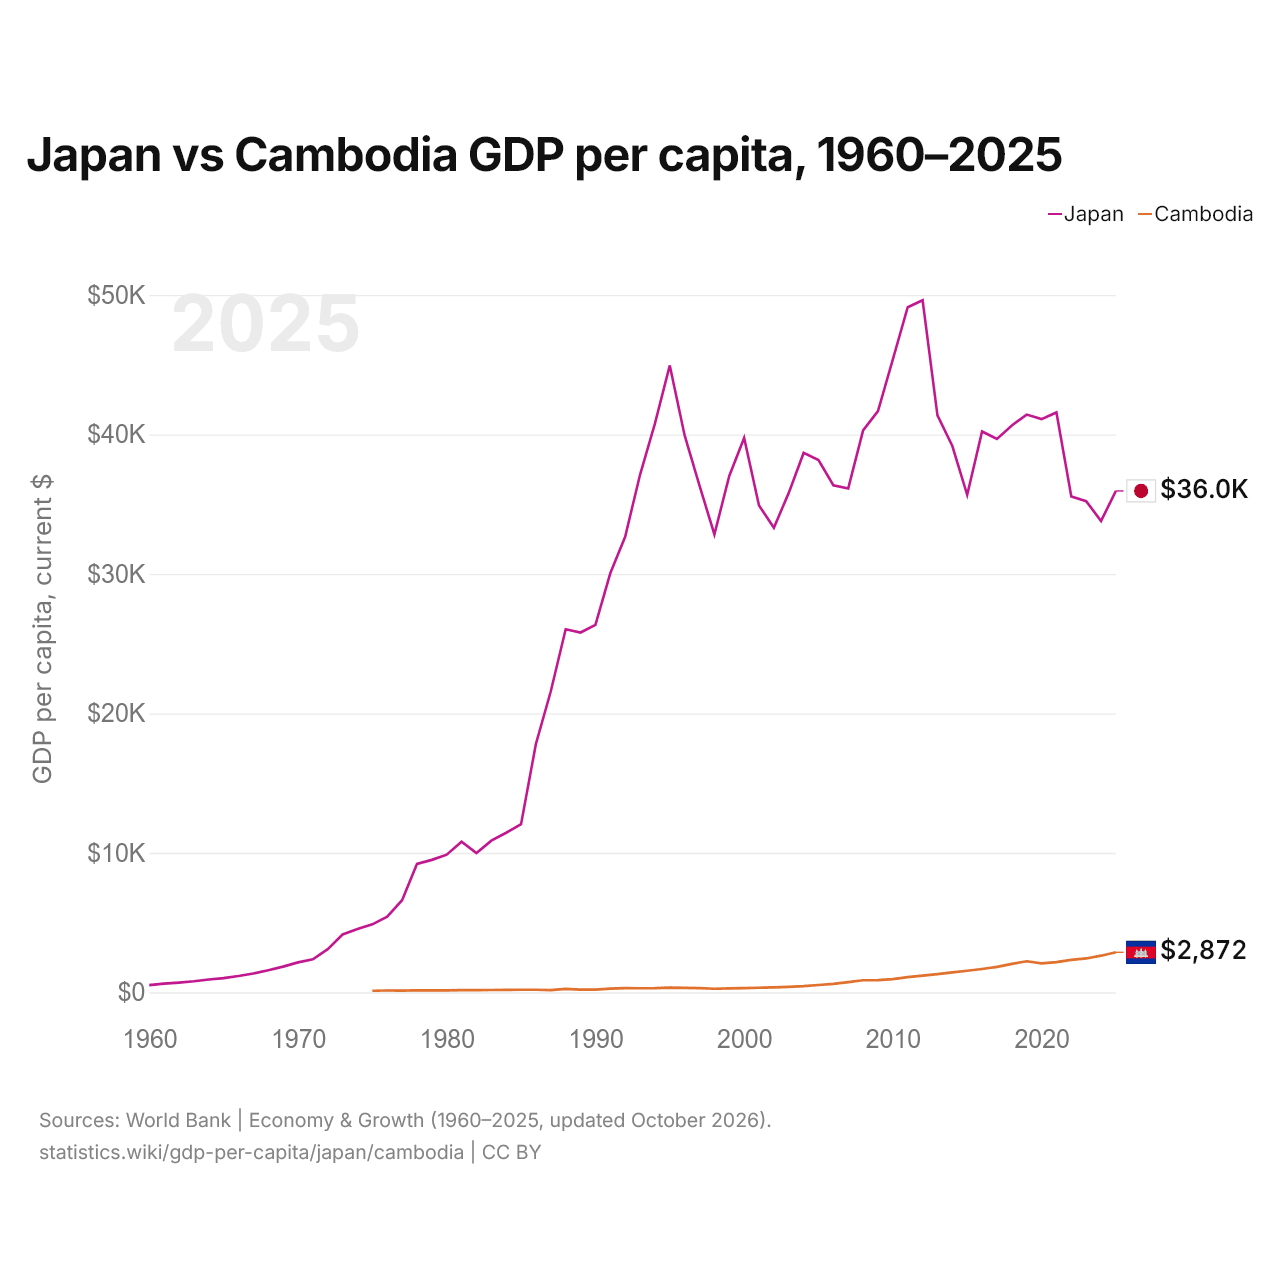
Japon vs Cambodge : PIB par habitant, 1960–2025
| Année | PIB par habitant, dollars US courants | |
|---|---|---|
 Japon |
 Cambodge |
|
| 2025 | 35 951 $ US | 2 872 $ US |
| 2024 | 33 797 $ US | 2 628 $ US |
| 2023 | 35 215 $ US | 2 430 $ US |
| 2022 | 35 548 $ US | 2 325 $ US |
| 2021 | 41 581 $ US | 2 167 $ US |
| 2020 | 41 099 $ US | 2 082 $ US |
| 2019 | 41 425 $ US | 2 226 $ US |
| 2018 | 40 645 $ US | 2 037 $ US |
| 2017 | 39 680 $ US | 1 826 $ US |
| 2016 | 40 215 $ US | 1 675 $ US |
| 2015 | 35 665 $ US | 1 547 $ US |
| 2014 | 39 173 $ US | 1 432 $ US |
| 2013 | 41 369 $ US | 1 306 $ US |
| 2012 | 49 627 $ US | 1 193 $ US |
| 2011 | 49 122 $ US | 1 089 $ US |
| 2010 | 45 378 $ US | 952 $ US |
| 2009 | 41 678 $ US | 876 $ US |
| 2008 | 40 294 $ US | 866 $ US |
| 2007 | 36 130 $ US | 732 $ US |
| 2006 | 36 354 $ US | 612 $ US |
| 2005 | 38 159 $ US | 526 $ US |
| 2004 | 38 678 $ US | 444 $ US |
| 2003 | 35 809 $ US | 387 $ US |
| 2002 | 33 316 $ US | 350 $ US |
| 2001 | 34 910 $ US | 328 $ US |
| 2000 | 39 753 $ US | 296,4 $ US |
| 1999 | 37 029 $ US | 286,8 $ US |
| 1998 | 32 835 $ US | 258,8 $ US |
| 1997 | 36 331 $ US | 297,6 $ US |
| 1996 | 39 930 $ US | 325 $ US |
| 1995 | 44 947 $ US | 343 $ US |
| 1994 | 40 774 $ US | 302 $ US |
| 1993 | 37 111 $ US | 294,1 $ US |
| 1992 | 32 667 $ US | 307 $ US |
| 1991 | 30 048 $ US | 267,3 $ US |
| 1990 | 26 345 $ US | 190,2 $ US |
| 1989 | 25 798 $ US | 191,3 $ US |
| 1988 | 26 037 $ US | 244,1 $ US |
| 1987 | 21 587 $ US | 158,1 $ US |
| 1986 | 17 819 $ US | 185,8 $ US |
| 1985 | 12 058 $ US | 182,4 $ US |
| 1984 | 11 443 $ US | 174,7 $ US |
| 1983 | 10 876 $ US | 166,7 $ US |
| 1982 | 9 986 $ US | 159,2 $ US |
| 1981 | 10 806 $ US | 154,3 $ US |
| 1980 | 9 872 $ US | 143,2 $ US |
| 1979 | 9 497 $ US | 142,2 $ US |
| 1978 | 9 202 $ US | 147,1 $ US |
| 1977 | 6 609 $ US | 126,4 $ US |
| 1976 | 5 422 $ US | 128,8 $ US |
| 1975 | 4 876 $ US | 113,8 $ US |
| 1974 | 4 542 $ US | - |
| 1973 | 4 147 $ US | - |
| 1972 | 3 095 $ US | - |
| 1971 | 2 370 $ US | - |
| 1970 | 2 145 $ US | - |
| 1969 | 1 841 $ US | - |
| 1968 | 1 586 $ US | - |
| 1967 | 1 354 $ US | - |
| 1966 | 1 168 $ US | - |
| 1965 | 1 015 $ US | - |
| 1964 | 922 $ US | - |
| 1963 | 792 $ US | - |
| 1962 | 699 $ US | - |
| 1961 | 622 $ US | - |
| 1960 | 519 $ US | - |
En 2025, le PIB par habitant était de 35 951 $ US au Japon et de 2 872 $ US au Cambodge : 13 fois plus élevé au Japon. En 1975, il était de 4 876 $ US au Japon et de 114 $ US au Cambodge, soit 43 fois plus au Japon.
Le PIB par habitant du Japon est plus élevé que celui du Cambodge chaque année depuis 1975. À prix constants de 2015, le PIB par habitant du Japon a été multiplié par 2,3 entre 1975 et 2025, et celui du Cambodge par 2,9.
Japon vs Cambodge : derniers chiffres du PIB par habitant
|
Japon
|
Cambodge
|
|
|---|---|---|
| PIB par habitant, dollars US courants | 35 951 $US | 2 872 $US |
| Rang mondial | 35/197 | 148/197 |
| PIB par habitant, dollars US constants de 2015 | 38 619 $US | 2 273 $US |
| × moyenne mondiale | 2,5× | 0,2× |
| Écart de PIB par habitant | 13× | 0,08× |
Comparer le PIB par habitant de 2 pays au choix
Sources :
- Banque mondiale | Économie et croissance (1960–2025, mis à jour en octobre 2026)
Creative Commons Attribution (CC BY) : vous pouvez copier, partager, adapter et réutiliser ce contenu, y compris à des fins commerciales, à condition de citer statistics.wiki et d’indiquer les modifications apportées. Les sources citées ci-dessus peuvent avoir leurs propres conditions de licence.