
Haïti vs République dominicaine : PIB par habitant, 1960–2025
| Année | PIB par habitant, dollars US courants | |
|---|---|---|
 Haïti |
 Rép. dominicaine |
|
| 2025 | 2 694 $ US | 11 059 $ US |
| 2024 | 2 060 $ US | 10 876 $ US |
| 2023 | 1 682 $ US | 10 630 $ US |
| 2022 | 1 748 $ US | 10 104 $ US |
| 2021 | 1 825 $ US | 8 527 $ US |
| 2020 | 1 290 $ US | 7 135 $ US |
| 2019 | 1 352 $ US | 8 183 $ US |
| 2018 | 1 496 $ US | 7 883 $ US |
| 2017 | 1 395 $ US | 7 413 $ US |
| 2016 | 1 318 $ US | 7 160 $ US |
| 2015 | 1 411 $ US | 6 801 $ US |
| 2014 | 1 460 $ US | 6 496 $ US |
| 2013 | 1 458 $ US | 6 137 $ US |
| 2012 | 1 361 $ US | 6 014 $ US |
| 2011 | 1 312 $ US | 5 827 $ US |
| 2010 | 1 210 $ US | 5 479 $ US |
| 2009 | 1 197 $ US | 4 974 $ US |
| 2008 | 1 095 $ US | 5 024 $ US |
| 2007 | 985 $ US | 4 650 $ US |
| 2006 | 829 $ US | 4 055 $ US |
| 2005 | 776 $ US | 3 878 $ US |
| 2004 | 683 $ US | 2 452 $ US |
| 2003 | 579 $ US | 2 383 $ US |
| 2002 | 721 $ US | 3 066 $ US |
| 2001 | 749 $ US | 2 936 $ US |
| 2000 | 821 $ US | 2 831 $ US |
| 1999 | 510 $ US | 2 621 $ US |
| 1998 | 465 $ US | 2 608 $ US |
| 1997 | 425 $ US | 2 449 $ US |
| 1996 | 377 $ US | 2 271 $ US |
| 1995 | 372 $ US | 2 109 $ US |
| 1994 | 292,1 $ US | 1 892 $ US |
| 1993 | 258,1 $ US | 1 722 $ US |
| 1992 | 316 $ US | 1 558 $ US |
| 1991 | 497 $ US | 1 346 $ US |
| 1990 | 452 $ US | 989 $ US |
| 1989 | 407 $ US | 955 $ US |
| 1988 | 397 $ US | 784 $ US |
| 1987 | 318 $ US | 868 $ US |
| 1986 | 367 $ US | 932 $ US |
| 1985 | 325 $ US | 784 $ US |
| 1984 | 299,2 $ US | 1 844 $ US |
| 1983 | 272,8 $ US | 1 500 $ US |
| 1982 | 252,6 $ US | 1 376 $ US |
| 1981 | 258,5 $ US | 1 288 $ US |
| 1980 | 246,5 $ US | 1 180 $ US |
| 1979 | 196,2 $ US | 984 $ US |
| 1978 | 180,3 $ US | 868 $ US |
| 1977 | 178,7 $ US | 863 $ US |
| 1976 | 169,1 $ US | 763 $ US |
| 1975 | 133,6 $ US | 713 $ US |
| 1974 | 113 $ US | 595 $ US |
| 1973 | 95,1 $ US | 490 $ US |
| 1972 | 77,3 $ US | 427 $ US |
| 1971 | 76,8 $ US | 368 $ US |
| 1970 | 71,5 $ US | 338 $ US |
| 1969 | 86,1 $ US | 287,7 $ US |
| 1968 | 82,4 $ US | 259,6 $ US |
| 1967 | 84,2 $ US | 256,2 $ US |
| 1966 | 85,7 $ US | 250,9 $ US |
| 1965 | 83,6 $ US | 233,2 $ US |
| 1964 | 78,5 $ US | 277,3 $ US |
| 1963 | 72,4 $ US | 262,2 $ US |
| 1962 | 70,4 $ US | 236,8 $ US |
| 1961 | 69 $ US | 193,9 $ US |
| 1960 | 70,8 $ US | 205,7 $ US |
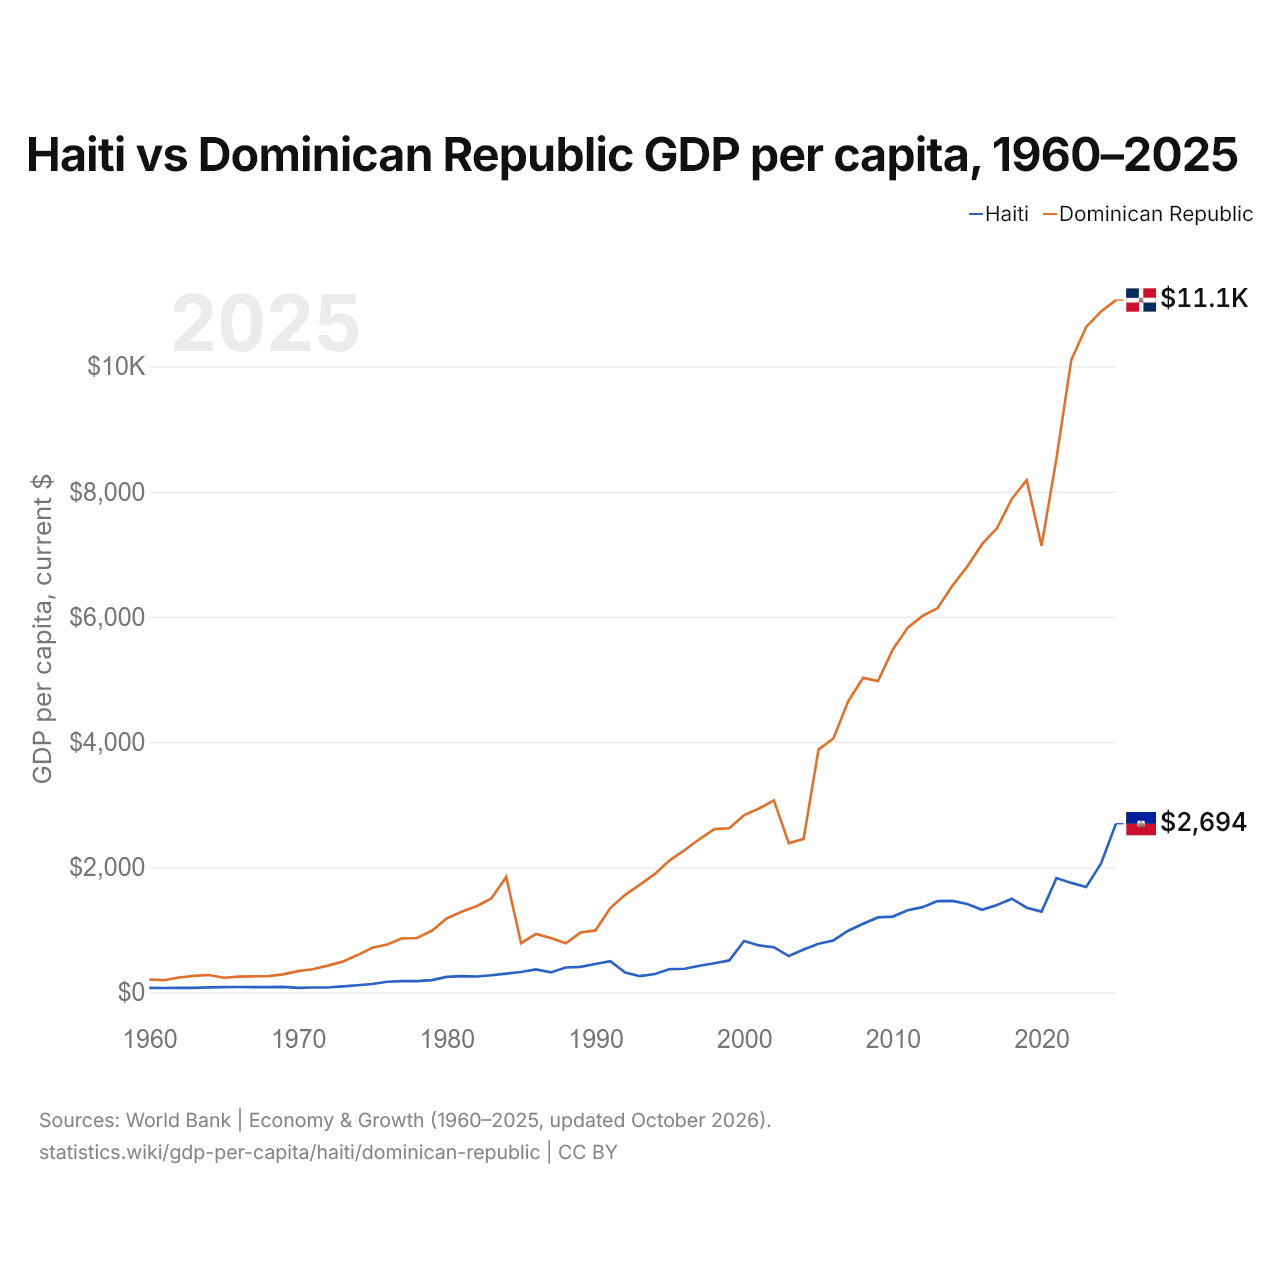
En 2025, le PIB par habitant était de 2 694 $ US en Haïti et de 11 059 $ US en République dominicaine : 4,1 fois plus élevé en République dominicaine. En 1960, il était de 71 $ US en Haïti et de 206 $ US en République dominicaine, soit 2,9 fois plus en République dominicaine.
Le PIB par habitant de la République dominicaine est plus élevé que celui d'Haïti chaque année depuis 1960. À prix constants de 2015, entre 1960 et 2025, le PIB par habitant d'Haïti a reculé de 36 %, et celui de la République dominicaine a progressé de 575 %.
Haïti vs République dominicaine : derniers chiffres du PIB par habitant
|
Haïti
|
Rép. dominicaine
|
|
|---|---|---|
| PIB par habitant, dollars US courants | 2 694 $US | 11 059 $US |
| Rang mondial | 150/197 | 83/197 |
| PIB par habitant, dollars US constants de 2015 | 1 111 $US | 9 287 $US |
| × moyenne mondiale | 0,19× | 0,77× |
| Écart de PIB par habitant | 0,24× | 4,1× |
Comparer le PIB par habitant de 2 pays au choix
Sources :
- Banque mondiale | Économie et croissance (1960–2025, mis à jour en octobre 2026)
Creative Commons Attribution (CC BY) : vous pouvez copier, partager, adapter et réutiliser ce contenu, y compris à des fins commerciales, à condition de citer statistics.wiki et d’indiquer les modifications apportées. Les sources citées ci-dessus peuvent avoir leurs propres conditions de licence.