
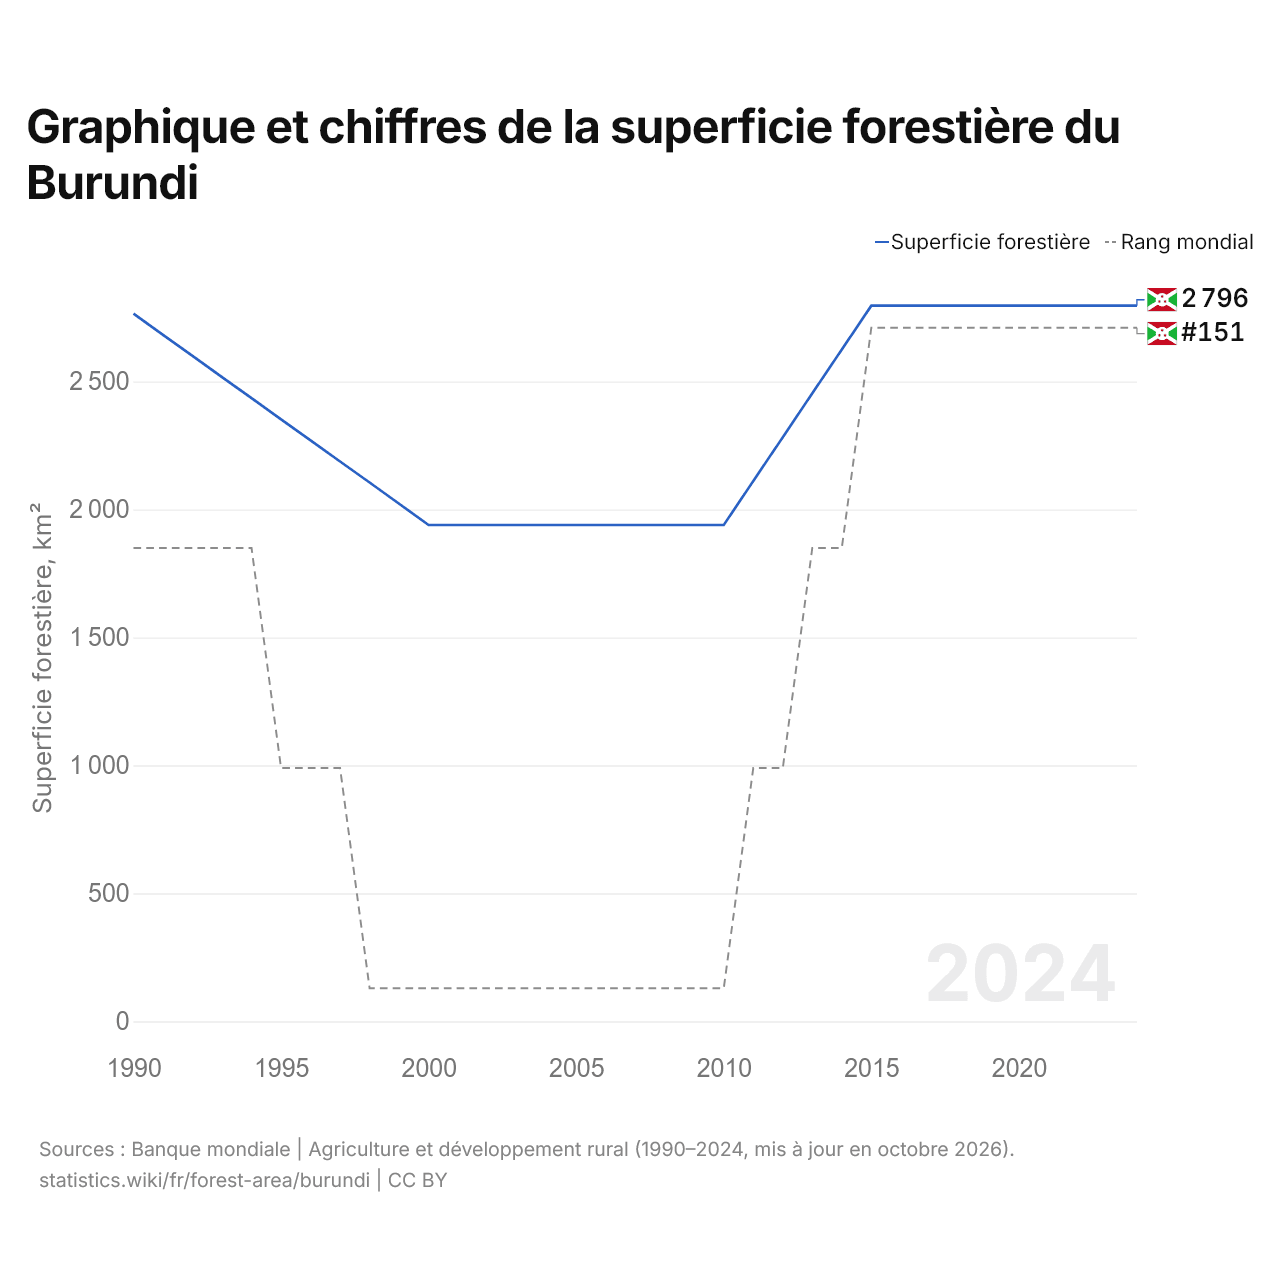
Graphique et chiffres de la superficie forestière du Burundi
| Année | Superficie forestière, km² | Rang mondial |
|---|---|---|
| Superficie forestière | ||
| 2024 | 2 796 | #151 |
| 2023 | 2 796 | #151 |
| 2022 | 2 796 | #151 |
| 2021 | 2 796 | #151 |
| 2020 | 2 796 | #151 |
| 2019 | 2 796 | #151 |
| 2018 | 2 796 | #151 |
| 2017 | 2 796 | #151 |
| 2016 | 2 796 | #151 |
| 2015 | 2 796 | #151 |
| 2014 | 2 625 | #152 |
| 2013 | 2 454 | #152 |
| 2012 | 2 282 | #153 |
| 2011 | 2 111 | #153 |
| 2010 | 1 939 | #154 |
| 2009 | 1 939 | #154 |
| 2008 | 1 939 | #154 |
| 2007 | 1 939 | #154 |
| 2006 | 1 939 | #154 |
| 2005 | 1 939 | #154 |
| 2004 | 1 939 | #154 |
| 2003 | 1 939 | #154 |
| 2002 | 1 939 | #154 |
| 2001 | 1 939 | #154 |
| 2000 | 1 939 | #154 |
| 1999 | 2 022 | #154 |
| 1998 | 2 105 | #154 |
| 1997 | 2 187 | #153 |
| 1996 | 2 270 | #153 |
| 1995 | 2 352 | #153 |
| 1994 | 2 435 | #152 |
| 1993 | 2 517 | #152 |
| 1992 | 2 600 | #152 |
| 1991 | 2 682 | #152 |
| 1990 | 2 765 | #152 |
La superficie forestière du Burundi est de 2 796 km² (1 080 mi²), contre 2 765 km² (1 068 mi²) en 1990. Sa superficie forestière a atteint son minimum en 2000, avec 1 939 km² (749 mi²). Elle se classe au 151e rang mondial, un rang qu'elle occupe depuis 2015.
La superficie forestière du Burundi occupe le 44e rang des 54 pays situés en Afrique, soit 0,042 % du total de la région. Les forêts couvrent 10,9 % de la superficie terrestre du Burundi. Les terres agricoles du Burundi couvrent 19 057 km² (7 358 mi²), soit 6,8 fois la superficie forestière.
| Superficie forestière du Burundi, 2024 | 2 796 km² |
|---|---|
| Superficie forestière, % de la superficie terrestre, 2024 | 10,9 % |
| Rang mondial par superficie | n° 151 sur 196 |
| Rang mondial par % de la superficie terrestre | n° 156 sur 196 |
| Superficie forestière par habitant, 2024 | 0,02 ha par habitant |
| Variation nette de la superficie forestière, 1990–2024 | +1,1 % |
Le Burundi dans le classement mondial de la superficie forestière
| Rang | Pays | Superficie forestière, km² | % de la superficie terrestre | Variation nette depuis 1990 | |
|---|---|---|---|---|---|
| 148 |
 Pays-Bas |
3 689 | 11,0 % | +6,8 % | |
| 149 |
 Arménie |
3 341 | 11,8 % | −0,1 % depuis 1992 | |
| 150 |
 EAU |
3 242 | 4,6 % | +3,0 % | |
| 151 |
 Burundi |
2 796 | 10,9 % | +1,1 % | |
| 152 |
 Trinité-et-Tobago |
2 265 | 44,2 % | −6,0 % | |
| 153 |
 Gambie |
2 160 | 21,3 % | −47,9 % | |
| 154 |
 Libye |
2 057 | 0,1 % | −5,2 % |
Comparer la superficie forestière du Burundi avec celle d'autres pays
Sources :
- Banque mondiale | Agriculture et développement rural (1990–2024, mis à jour en octobre 2026)
Creative Commons Attribution (CC BY) : vous pouvez copier, partager, adapter et réutiliser ce contenu, y compris à des fins commerciales, à condition de citer statistics.wiki et d’indiquer les modifications apportées. Les sources citées ci-dessus peuvent avoir leurs propres conditions de licence.