
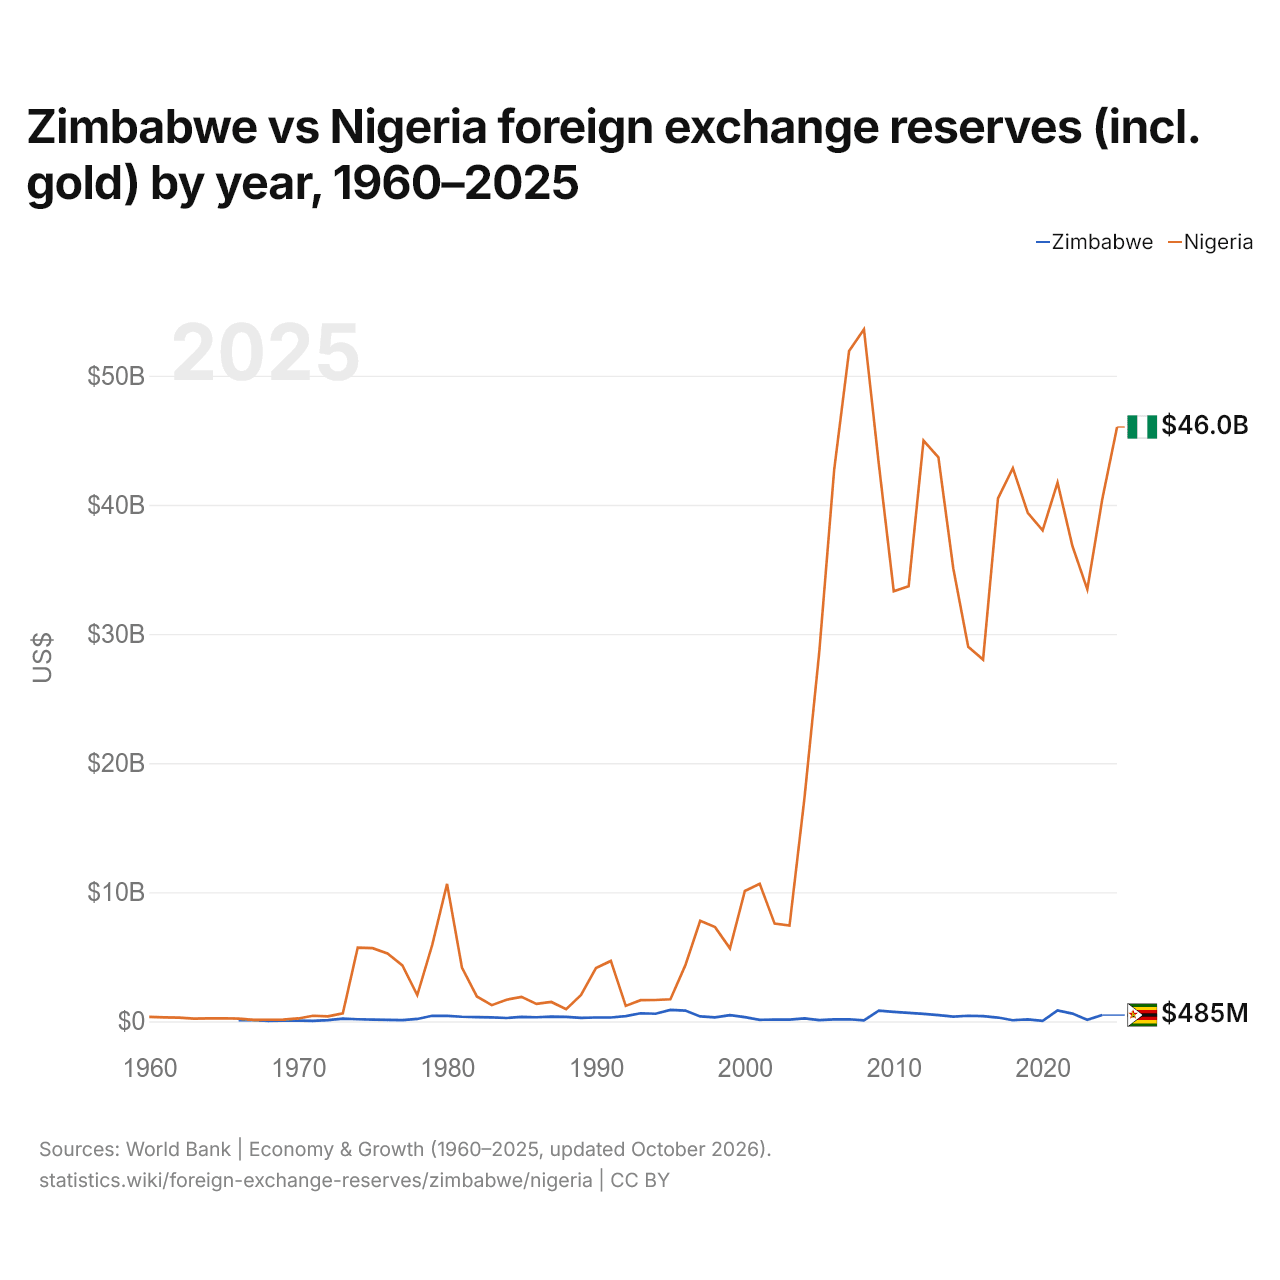
Zimbabwe vs Nigeria : réserves de change (or compris) par année, 1960–2025
| Année | $ US | |
|---|---|---|
 Zimbabwe |
 Nigeria |
|
| 2025 | - | 46 024 916 767 $ US |
| 2024 | 484 972 805 $ US | 40 405 994 025 $ US |
| 2023 | 115 529 710 $ US | 33 452 495 122 $ US |
| 2022 | 598 621 574 $ US | 36 809 762 970 $ US |
| 2021 | 838 780 245 $ US | 41 727 503 547 $ US |
| 2020 | 33 405 021 $ US | 38 028 751 518 $ US |
| 2019 | 151 240 507 $ US | 39 382 191 479 $ US |
| 2018 | 86 951 094 $ US | 42 838 869 125 $ US |
| 2017 | 292 621 249 $ US | 40 499 220 796 $ US |
| 2016 | 407 193 244 $ US | 28 020 197 619 $ US |
| 2015 | 434 586 086 $ US | 29 011 450 144 $ US |
| 2014 | 363 832 802 $ US | 35 070 259 874 $ US |
| 2013 | 474 968 710 $ US | 43 675 023 638 $ US |
| 2012 | 575 552 811 $ US | 44 973 806 132 $ US |
| 2011 | 660 229 297 $ US | 33 691 784 436 $ US |
| 2010 | 731 779 022 $ US | 33 305 051 216 $ US |
| 2009 | 821 891 030 $ US | 43 129 830 238 $ US |
| 2008 | 81 875 983 $ US | 53 598 093 557 $ US |
| 2007 | 163 198 334 $ US | 51 906 164 586 $ US |
| 2006 | 154 593 587 $ US | 42 735 039 033 $ US |
| 2005 | 97 191 584 $ US | 28 632 051 717 $ US |
| 2004 | 234 290 934 $ US | 17 256 543 969 $ US |
| 2003 | 136 092 039 $ US | 7 415 087 386 $ US |
| 2002 | 131 685 658 $ US | 7 566 806 239 $ US |
| 2001 | 119 459 329 $ US | 10 646 598 366 $ US |
| 2000 | 321 301 858 $ US | 10 099 448 198 $ US |
| 1999 | 480 423 302 $ US | 5 649 725 441 $ US |
| 1998 | 309 771 241 $ US | 7 298 545 693 $ US |
| 1997 | 383 550 560 $ US | 7 781 250 309 $ US |
| 1996 | 834 393 883 $ US | 4 329 391 828 $ US |
| 1995 | 887 899 729 $ US | 1 709 113 521 $ US |
| 1994 | 585 403 254 $ US | 1 649 172 399 $ US |
| 1993 | 628 149 930 $ US | 1 640 443 739 $ US |
| 1992 | 404 469 002 $ US | 1 196 052 750 $ US |
| 1991 | 295 014 165 $ US | 4 678 023 330 $ US |
| 1990 | 295 117 985 $ US | 4 128 789 618 $ US |
| 1989 | 274 210 790 $ US | 2 041 078 374 $ US |
| 1988 | 340 678 141 $ US | 932 989 777 $ US |
| 1987 | 370 440 189 $ US | 1 497 832 059 $ US |
| 1986 | 316 314 907 $ US | 1 349 903 027 $ US |
| 1985 | 345 468 090 $ US | 1 891 868 244 $ US |
| 1984 | 259 960 292 $ US | 1 674 113 905 $ US |
| 1983 | 300 443 310 $ US | 1 251 986 799 $ US |
| 1982 | 320 466 115 $ US | 1 926 433 779 $ US |
| 1981 | 354 712 720 $ US | 4 168 449 636 $ US |
| 1980 | 419 235 500 $ US | 10 639 786 873 $ US |
| 1979 | 432 020 000 $ US | 5 899 642 026 $ US |
| 1978 | 184 406 000 $ US | 2 028 808 604 $ US |
| 1977 | 97 632 400 $ US | 4 335 987 601 $ US |
| 1976 | 112 348 750 $ US | 5 256 784 369 $ US |
| 1975 | 129 177 750 $ US | 5 665 692 312 $ US |
| 1974 | 164 413 000 $ US | 5 708 969 927 $ US |
| 1973 | 208 907 500 $ US | 622 853 179 $ US |
| 1972 | 97 094 800 $ US | 390 711 739 $ US |
| 1971 | 41 695 710 $ US | 431 942 651 $ US |
| 1970 | 59 433 760 $ US | 223 498 270 $ US |
| 1969 | 56 120 400 $ US | 132 459 200 $ US |
| 1968 | 37 213 800 $ US | 121 194 900 $ US |
| 1967 | 89 052 800 $ US | 112 359 200 $ US |
| 1966 | 87 074 890 $ US | 215 353 490 $ US |
| 1965 | - | 239 053 520 $ US |
| 1964 | - | 228 053 520 $ US |
| 1963 | - | 210 030 680 $ US |
| 1962 | - | 289 024 970 $ US |
| 1961 | - | 307 070 650 $ US |
| 1960 | - | 343 000 000 $ US |
Les réserves de change du Zimbabwe s'élevaient à 485 millions de dollars (2024) et celles du Nigeria à 40,4 milliards de dollars (2024) : celles du Nigeria étaient 83 fois plus élevées. En 1966, les réserves du Nigeria étaient 2,5 fois plus élevées : 87,1 millions de dollars pour le Zimbabwe et 215 millions de dollars pour le Nigeria.
Les réserves de change du Nigeria sont supérieures à celles du Zimbabwe chaque année depuis 1966.
Zimbabwe vs Nigeria : réserves, or compris, et mois d'importations couverts
|
Zimbabwe
|
Nigeria
|
|
|---|---|---|
| Réserves, or compris | 485 M $US (2024) | 46,0 Md $US (2025) |
| Mois d'importations | 0,6 (2024) | n.d. |
| Rang mondial | 154/168 | 53/168 |
Comparer les réserves de change de 2 pays au choix
Sources :
- Banque mondiale | Économie et croissance (1960–2025, mis à jour en octobre 2026)
Creative Commons Attribution (CC BY) : vous pouvez copier, partager, adapter et réutiliser ce contenu, y compris à des fins commerciales, à condition de citer statistics.wiki et d’indiquer les modifications apportées. Les sources citées ci-dessus peuvent avoir leurs propres conditions de licence.